Q2 2026 Capital Market Update: The Anna Karenina Principle
July 7, 2026

by Bradley Wallace, CFA®
"All happy families are alike; each unhappy family is unhappy in its own way." – Leo Tolstoy
In his 1877 novel Anna Karenina, Leo Tolstoy writes of two contrasting but parallel family story lines. Anna Karenina’s story centers around complex relationships and constant short-term gratification, ultimately leading her to be consumed by anxiety and insecurity. Konstantin Levin, on the other hand, embraced simplicity after coming to the realization that life’s deepest satisfactions could be tied to a short list of simple values: family, meaningful work, faith and responsibility.
Tolstoy’s opening line of the novel is arguably one of the best in literature, “All happy families are alike; each unhappy family is unhappy in its own way.” This concept eventually led to the naming of a scientific rule titled the Anna Karenina principle. The principle states that success in complex endeavors requires certain factors to be present and working correctly, and that the endeavor cannot succeed if even one of these essential factors is missing. In other words, success often looks the same while there are many ways to fail.
Aside from being a generally good approach to life, Tolstoy’s novel is remarkably analogous to investors and their philosophical approach to the otherwise complex endeavor of long-term investing. Particularly as it relates to stewarding generational wealth, success in preserving, growing and transferring a family’s legacy over multiple generations often looks the same across families, while wealth erosion and broken family relationships can come in a variety of forms.
As we enter the second half of 2026 with a divergent economy that has presented higher-for-longer interest rates and inflation, increasing dispersion among both asset valuations and returns, and anticipated new stocks coming to market via IPO, the long-term advantage is likely to belong to investors focusing on the short list of simple truths – diversification, discipline, fundamentals and valuations - rather than those making impulsive decisions centered around short-term gratification.
Source: Infinity Private Wealth, Federal Reserve Bank of St. Louis
Divergence
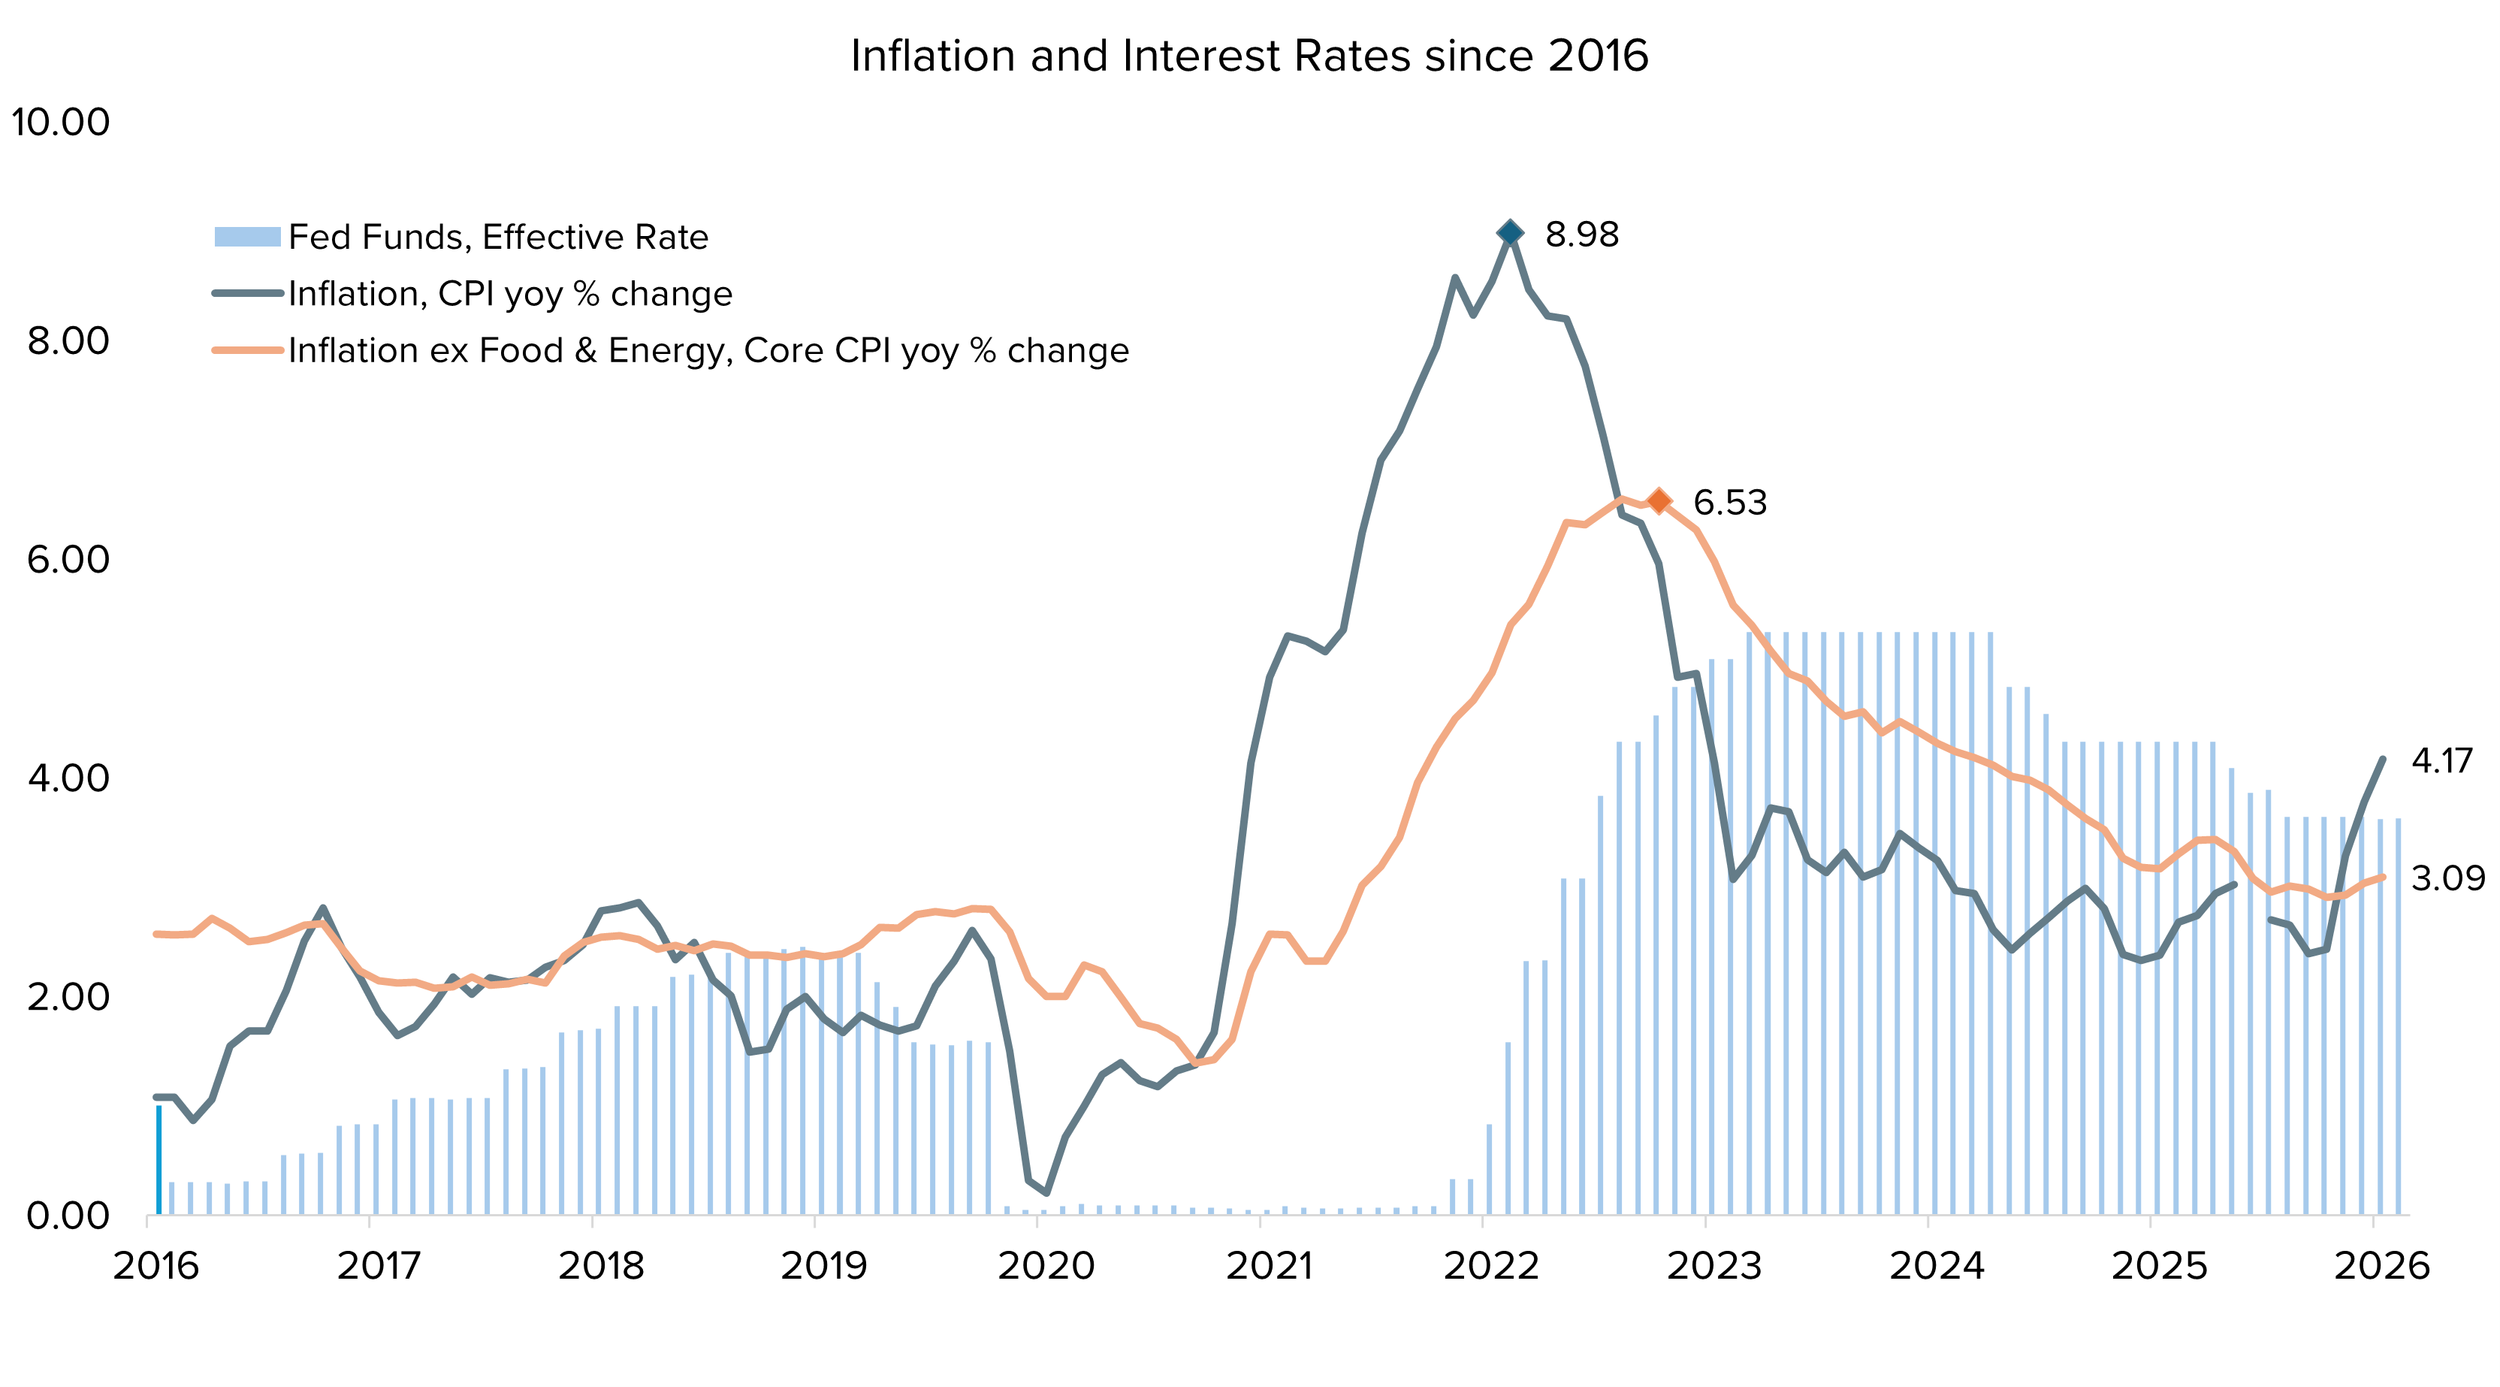
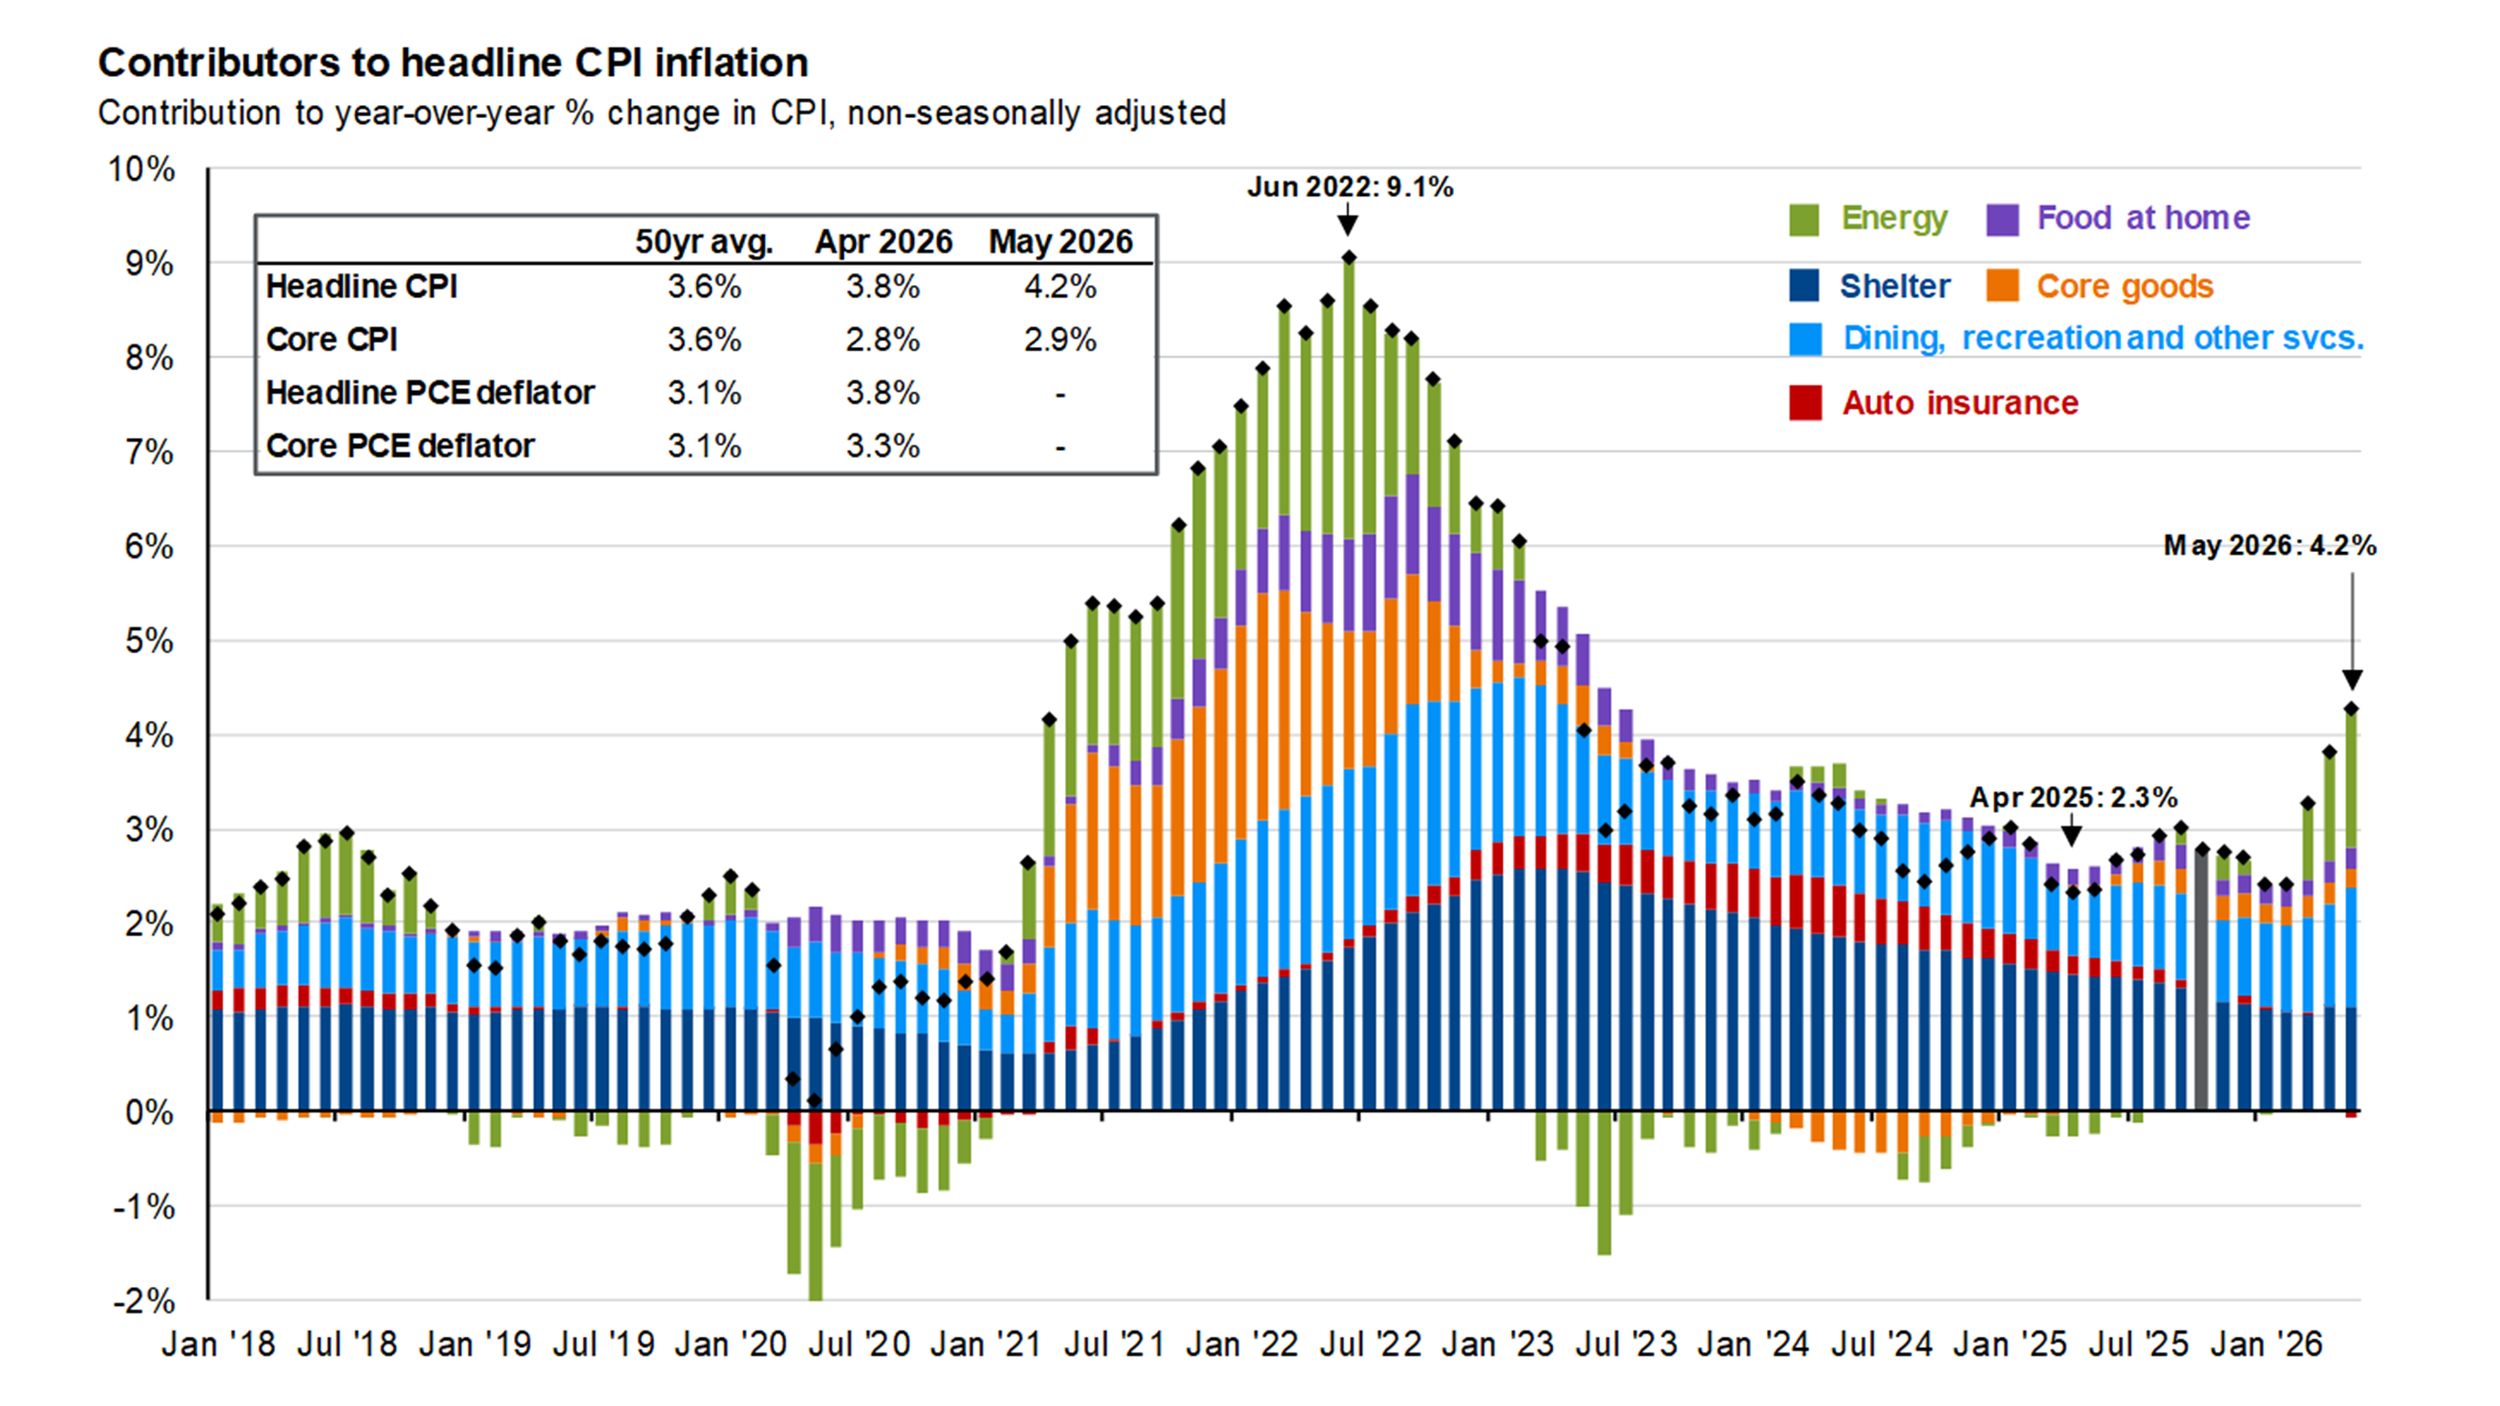
As expected, elevated oil prices drove headline inflation meaningfully higher over the second quarter as the geopolitical conflict in Iran lingered. And while some progress was made toward a resolution, the reopening of a passage the size of Hormuz is not as simple as flipping a switch. From the beginning of March to its peak in early April, the price of WTI crude oil spiked from near $70/bbl to more than $110. As of the end of June, however, the commodity has fallen back below $70/bbl, which could relieve the inflationary pressure for energy in the months ahead. This sharp ~60% increase in oil prices led to rising input prices across the economy, ultimately driving year-over-year inflation up to 4.2% as of May’s report. For perspective, headline inflation at the beginning of 2026 was 2.4%, near the Federal Reserve’s long-term 2% target level.
Source: BLS, FactSet, J.P. Morgan Asset Management.
While this increase in inflation could stoke worries about another inflationary cycle, stripping out price changes for food and energy paints a more encouraging picture. Core inflation, which excludes these two volatile categories, increased much less over the first half of the year, with a May report of 2.8% versus 2.5% in January. Broadly speaking, U.S. inflation appears to be rangebound at a manageable level assuming continued progress is made in the Middle East.
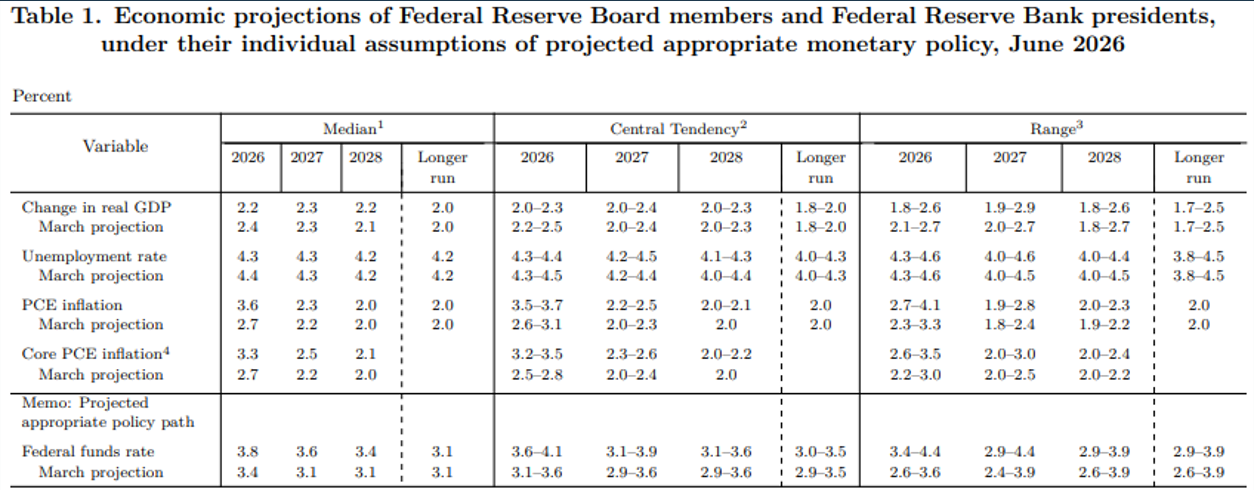
Along with rising inflation and geopolitical uncertainty, the Federal Reserve also navigated a change in leadership in the second quarter. Kevin Warsh assumed the office as Chair of the Federal Reserve in May, succeeding Jay Powell who had led the institution since 2018. As with any regime change, uncertainty in Warsh’s approach to monetary policy led to a short-lived selloff in equity markets, with the S&P 500 declining 1.2% on the day of Warsh’s first official Fed meeting. Adding to uncertainty was the release of the Fed’s Summary of Economic Projections in June (shown below), where Fed members update their individual economic forecasts. Perhaps the most surprising update was the level of interest rates through 2028, which are expected between 40-50 bps higher than expectations in March. In short, policy expectations moved from two rate cuts to start the year, to no change in Q1, to some members now expecting two rate hikes.
Source: U.S. Federal Reserve
Time will tell how monetary policy might change as a result of new Fed leadership, but long-term investors ought not be consumed with day-to-day (or even year-to-year) policy headlines. In the long run, business fundamentals drive equity returns more so than short-term policy decisions.
Shifting Curves and Expectations
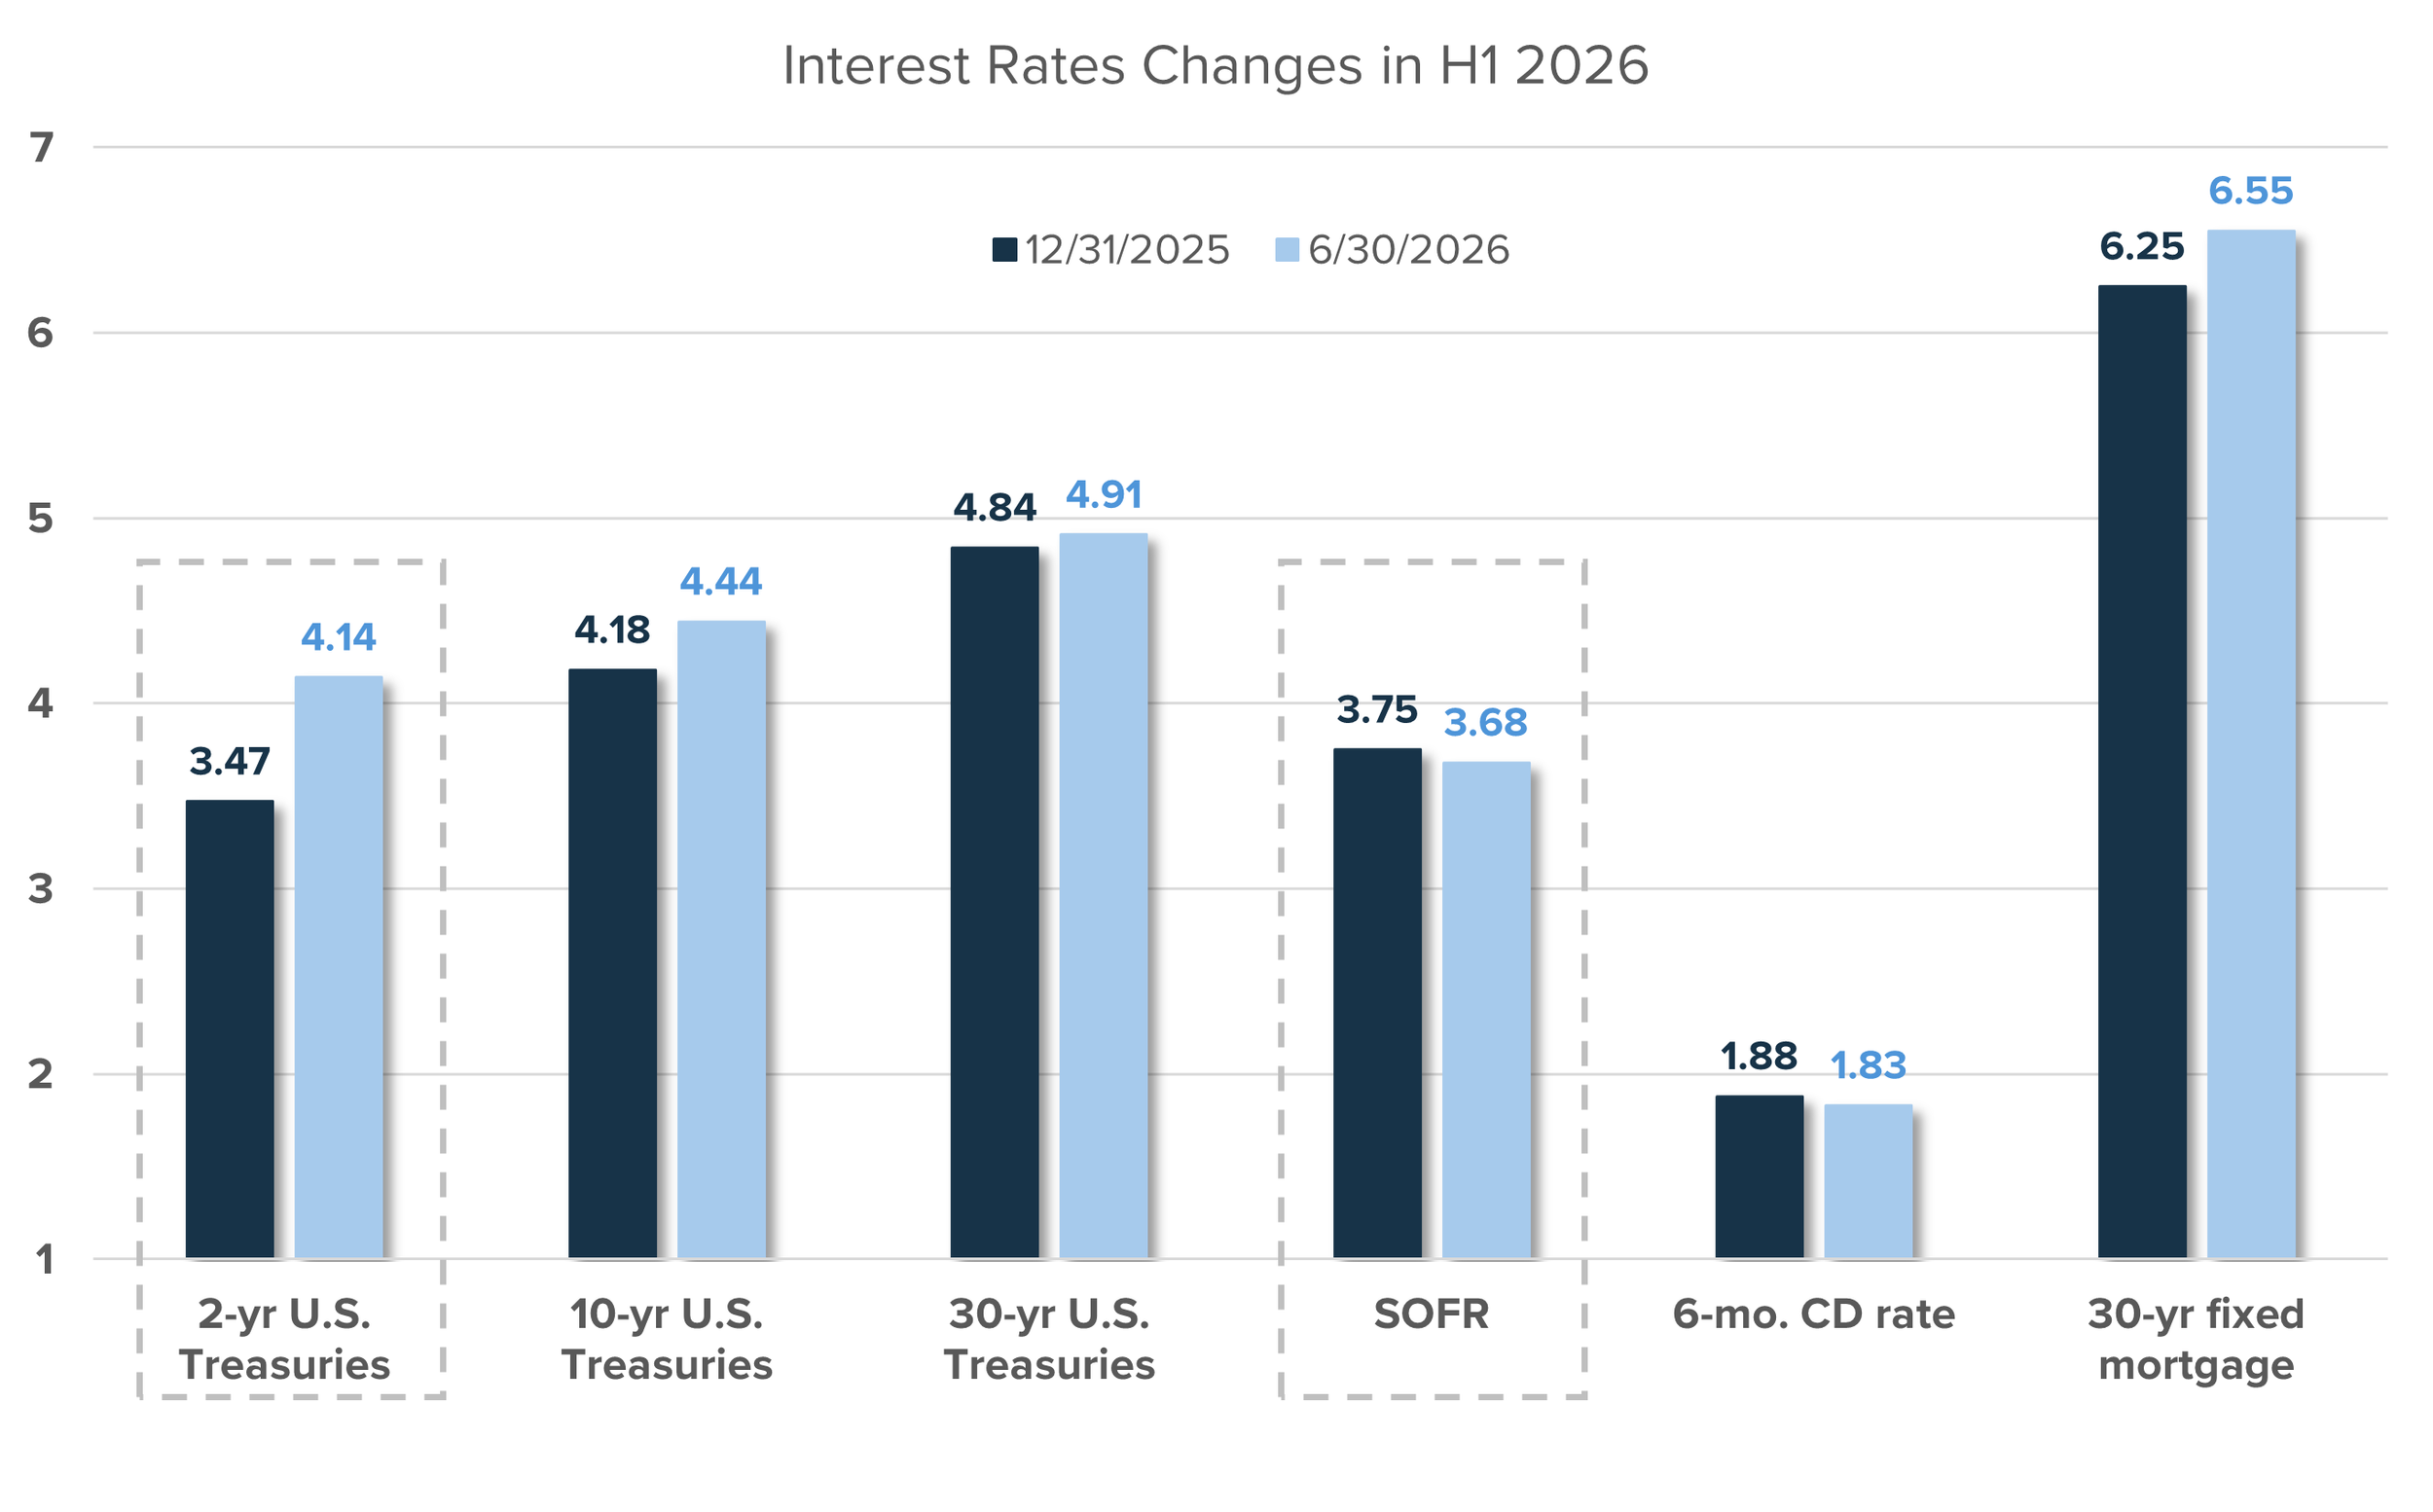
Adding to divergence within the economy, interest rate markets displayed a similar path over the first half of 2026, as investor expectations and current monetary policy seemed to diverge. As inflation rose on the back of higher energy prices, jobs data proved resilient, and a new Federal Reserve Chair communicated a more hawkish stance than previous leadership, investors drove the 2-year US Treasury yield higher by about 67 basis points over the 6-month period. Conversely, the Secured Overnight Financing Rate (SOFR), which is the benchmark lending rate that effectively tracks the Fed Funds rate, declined slightly. This divergence suggests that investors expect future interest rate policy to be meaningfully higher than today. In short, SOFR is reflective of current monetary policy, while the 2-year US Treasury yield reflects market expectations. This is important, as investment returns are often driven more from expectations of the future rather than data from today or yesterday.
Source: Infinity Private Wealth, Federal Reserve Bank of St. Louis
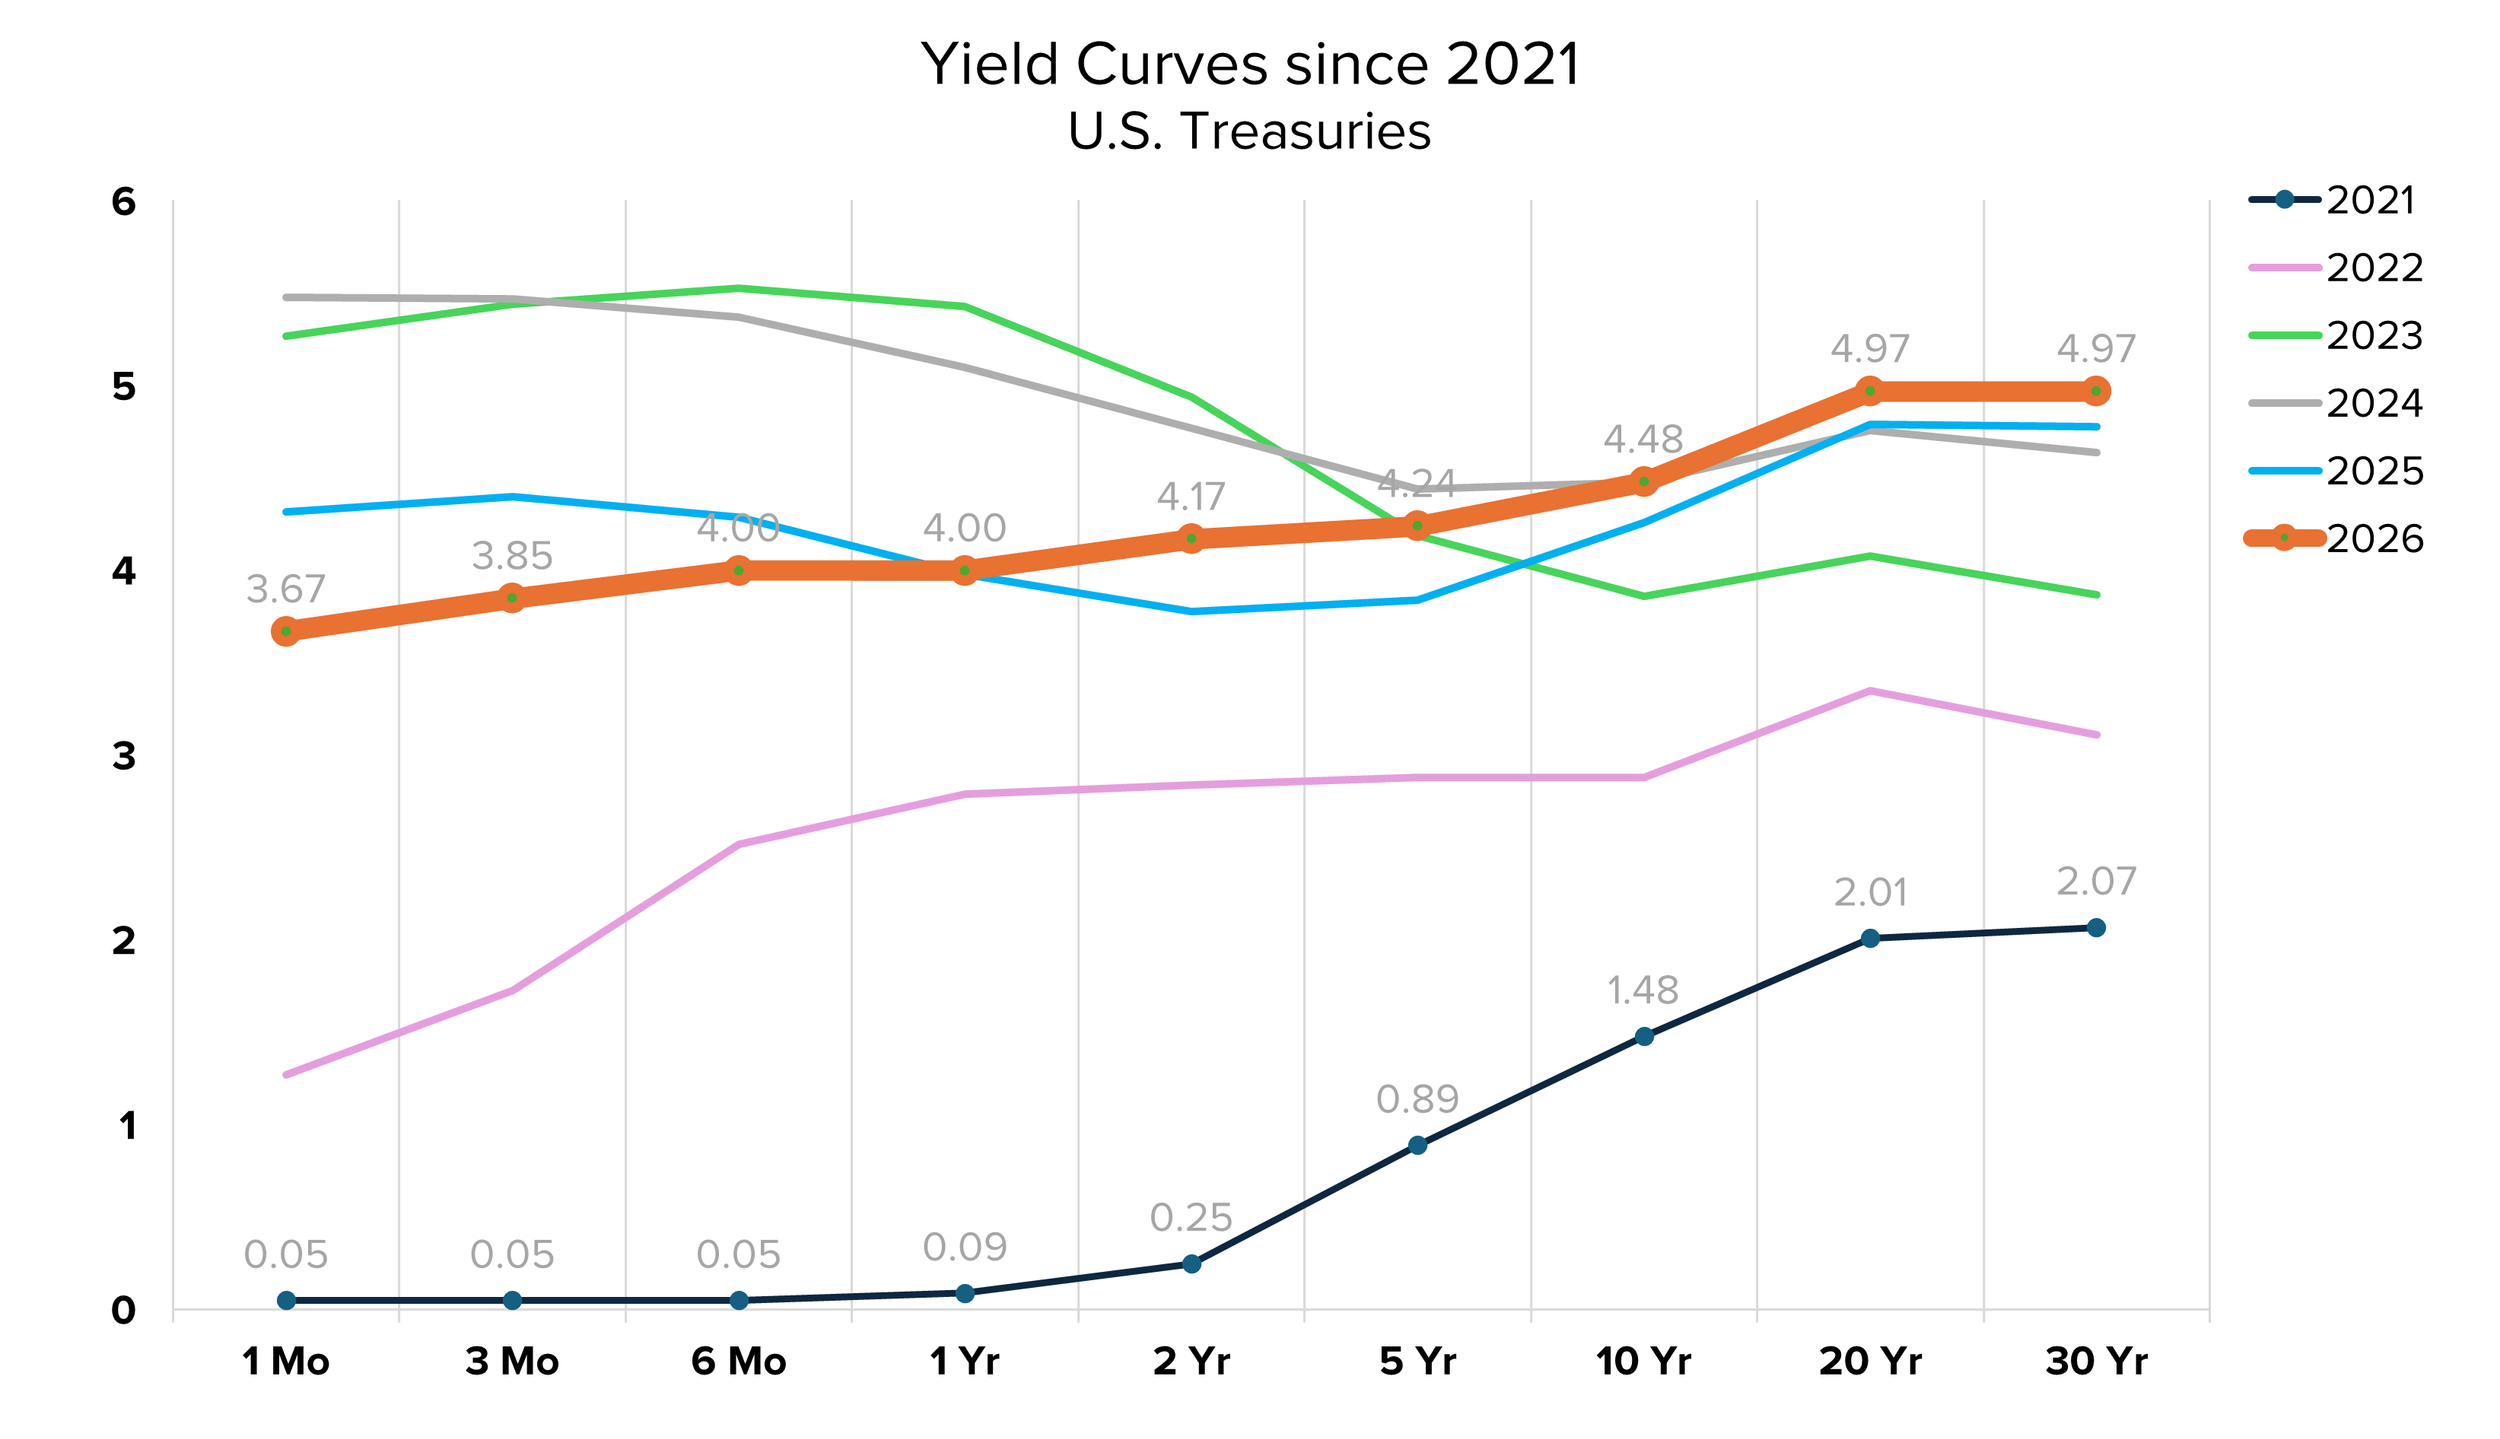
Along with the level of interest rates, market expectations also drive the shape of an interest rate yield curve – a yield curve is the graphical representation of a security’s annual yield at different points of maturity, as shown below. In theory, the longer the maturity of a fixed income security, the higher the yield should be to compensate investors for lending capital for a longer period of time. But markets are not theoretical; rather, they’re made of up human investors who have expectations of their own and investment mandates to fulfill. In practice, therefore, yield curves can shift and change into very different shapes depending on the divergence between current economic factors and future expectations.
Following the Fed’s aggressive rate hiking-cycle in 2022, the US Treasury yield curve was “inverted” for quite some time, as short-term rates provided a higher annual yield than longer-term rates, as seen in the light green line graph. This yield inversion has historically been accompanied by, or the cause of, an economic recession. Fortunately, this was not the case (at least on a broad scale) in 2023. Since then, the Treasury yield curve has normalized, with short-term rates declining and longer-term rates rising, once again compensating fixed income investors for moving out of cash-like investments and into longer-maturity bonds.
Source: Source: Infinity Private Wealth, U.S. Department of the Treasury
Today, with higher starting yields and a normalized curve, investors have more opportunity to diversify their investment strategy by locking in these higher rates further out on the maturity curve. Even with the uncertainty of future interest rate paths, taking advantage of what the market is offering today can pay dividends – or, interest – for years to come. Historically, starting yields for fixed income investors have been tightly correlated with forward long-term returns. For perspective, investors today are looking at bond yields that are nearly 4% higher than was available just five years ago. In an ultra low-rate environment, today’s backdrop is often wished upon.
History Over Headlines
Stocks started the year strong, reaching several new all-time highs as the economy powered forward, inflation fell, and AI’s rapid advancement began showing signs of increased revenue and wider margins for public companies around the world. Then, in the middle of the first quarter the momentum waned. Most major stock indexes entered a correction (decline of 10% or more) and the average individual stock within the indexes declined anywhere from 20-40%. With conflict in the middle east, the price of oil soaring to over $100/bbl and uncertainty around inflation and interest rates, equities fell swiftly. This created discomfort and irrationality for the “Anna Karenina” investor that was distracted by the headlines of the day; and it created pockets of opportunity for the “Levin” investor that was focused on what mattered most for long-term investing: discipline, patience and fundamentals.
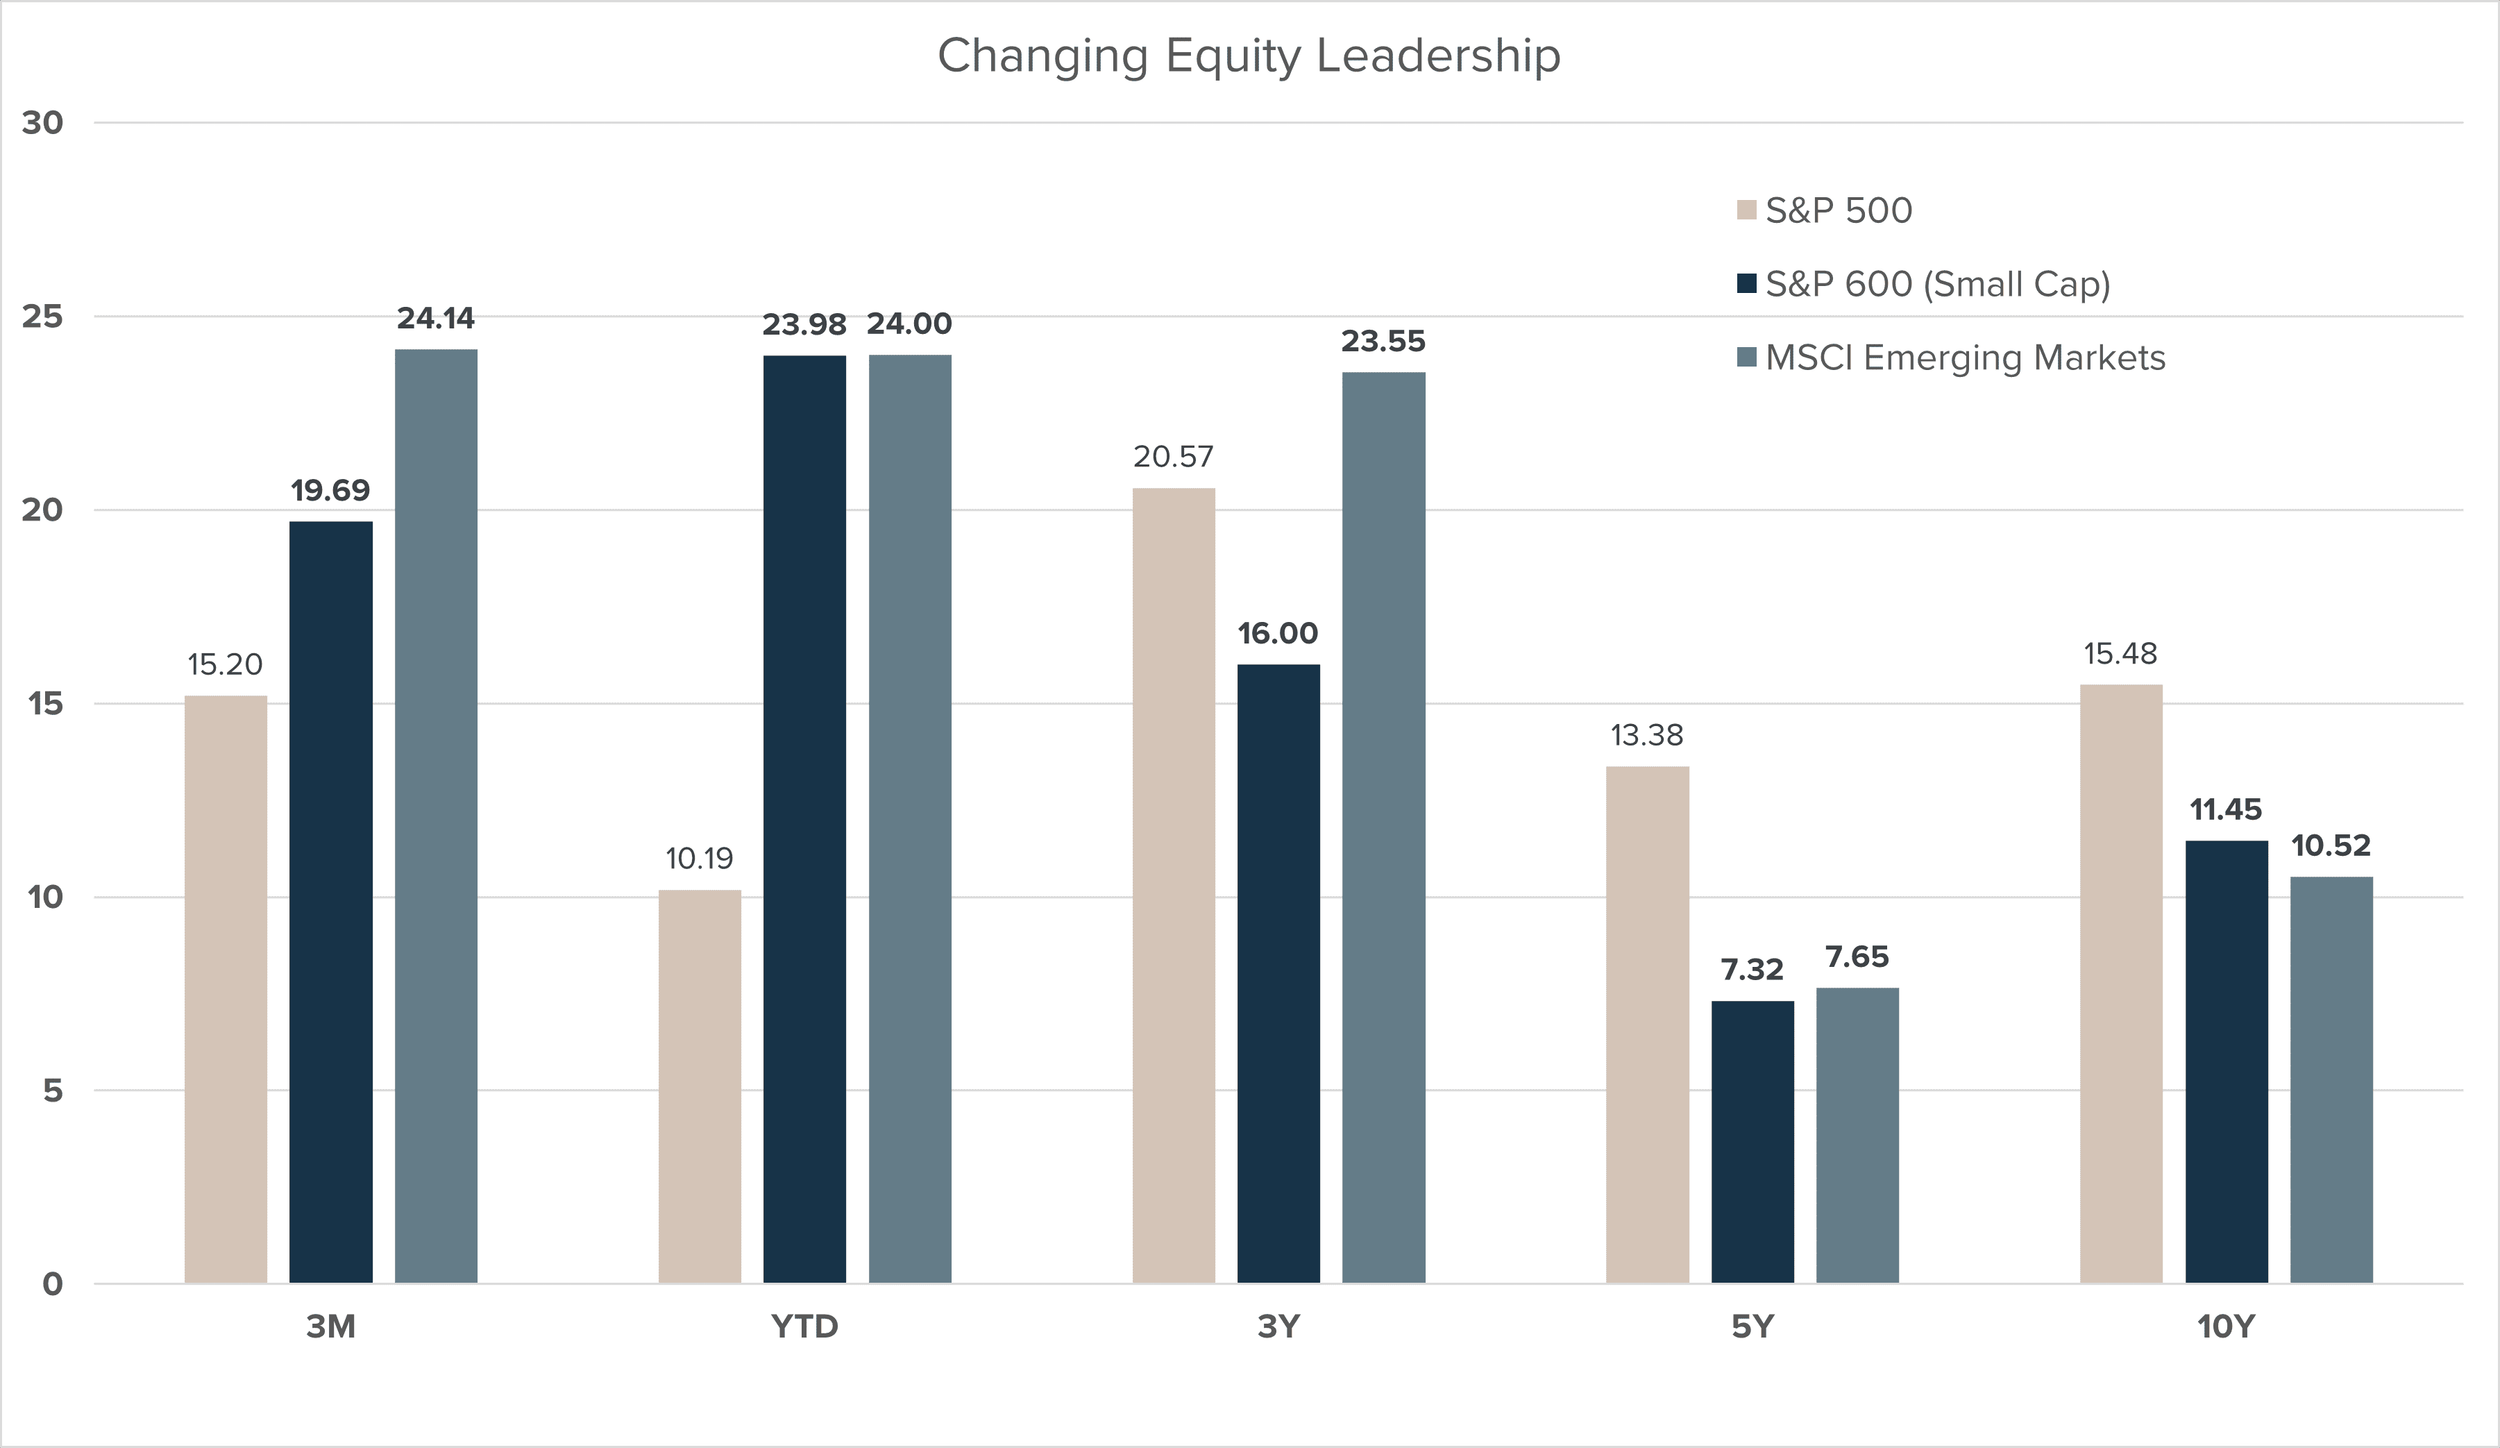
The second quarter of the year delivered the best three-month period for stocks since 2020. The S&P 500 was up more than 15% in Q2 following the first quarter decline, while small caps gained 20% and emerging market stocks nearly 24% over the quarter.
As shown in the chart below, this broadening – where equity leadership begins to rotate across other classes – in small cap and emerging market equities began taking shape at the start of the year. For investors who understand history, this reversion to the mean for small cap equities was broadly expected. While the unknown variable is always timing, given the starting valuations in small caps and relative underperformance compared to their large cap peers, expected forward returns had risen in recent quarters.
Source: Infinity Private Wealth, Northern Trust Investment Institute
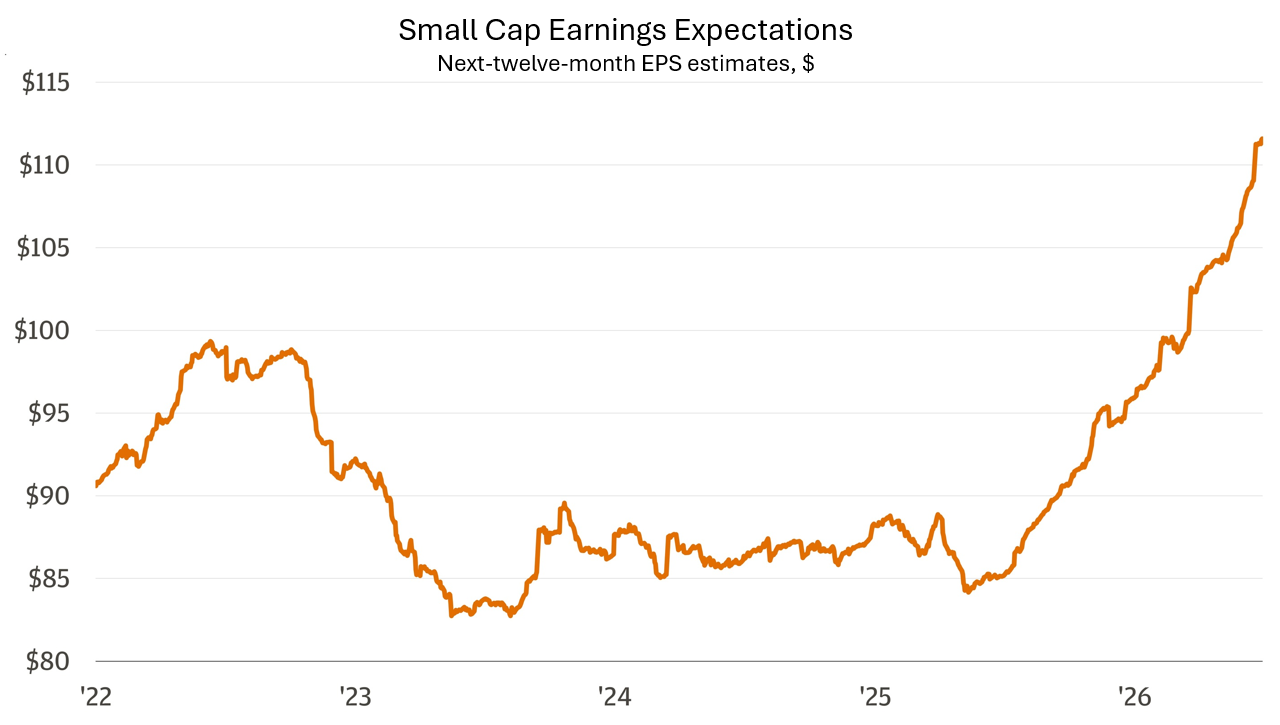
Perhaps encouraging for the question of sustainability, this recent performance for small caps has been largely driven by a surge in expected earnings as shown below. Small cap companies, and to a similar extent emerging market companies, perform better during periods of declining interest rates, high industrial capital expenditure and moderating input costs. This is precisely the backdrop that we came into the year with, providing a welcome tailwind for small cap and emerging market equities. Will this momentum continue? Only time will tell, but small caps as a whole still appear to be trading at a larger discount to large caps than has been the case historically – 20% today versus a 10-year average of 10% according to JPMorgan Private Bank.
Source: Bloomberg Finance L.P. JPMorgan Private Bank, Data as of June 30, 2026.
For long-term equity investors, the question is not IF diversification is valuable, but WHEN it will become so. Different parts of the market shine at different times, the arguably impossible challenge is determining when those times will come. By focusing instead on a disciplined adherence to thoughtful asset allocation, prudent risk management and diligent security selection, long-term returns tend to take care of themselves.
Facts Over Forecasts
As we enter the second half of 2026, in the midst of rapid innovation, evolving capital markets and a race to the top for public company leadership, it’s important for long-term investors to take a step back and remind ourselves of the key components of long-term investing success. Like the Anna Karenina principle states, for a complex endeavor to succeed, all required components must be present and working properly, while the absence of even one of these essential elements will cause the endeavor to fail. Long-term investing, to some extent, is a complex endeavor. Given the number and magnitude of various economic cycles that occur during an investor's lifetime, market declines and bouts of volatility, as well as our own behavioral biases like overconfidence, recency, and FOMO.
In investing, a common component that can lead to investment ruin is the overreliance of forecasts rather than facts. As Yogi Berra said, “it’s tough to make predictions, especially about the future.” This is so commonly displayed in investing because much of what investors buy today depends on some future outcome, whether it’s cash flow, price appreciation, or both. But there’s a fine line between overreliance and consideration in one’s investment decision-making process. Forecasts should be considered but can quickly become a risk when used in isolation.
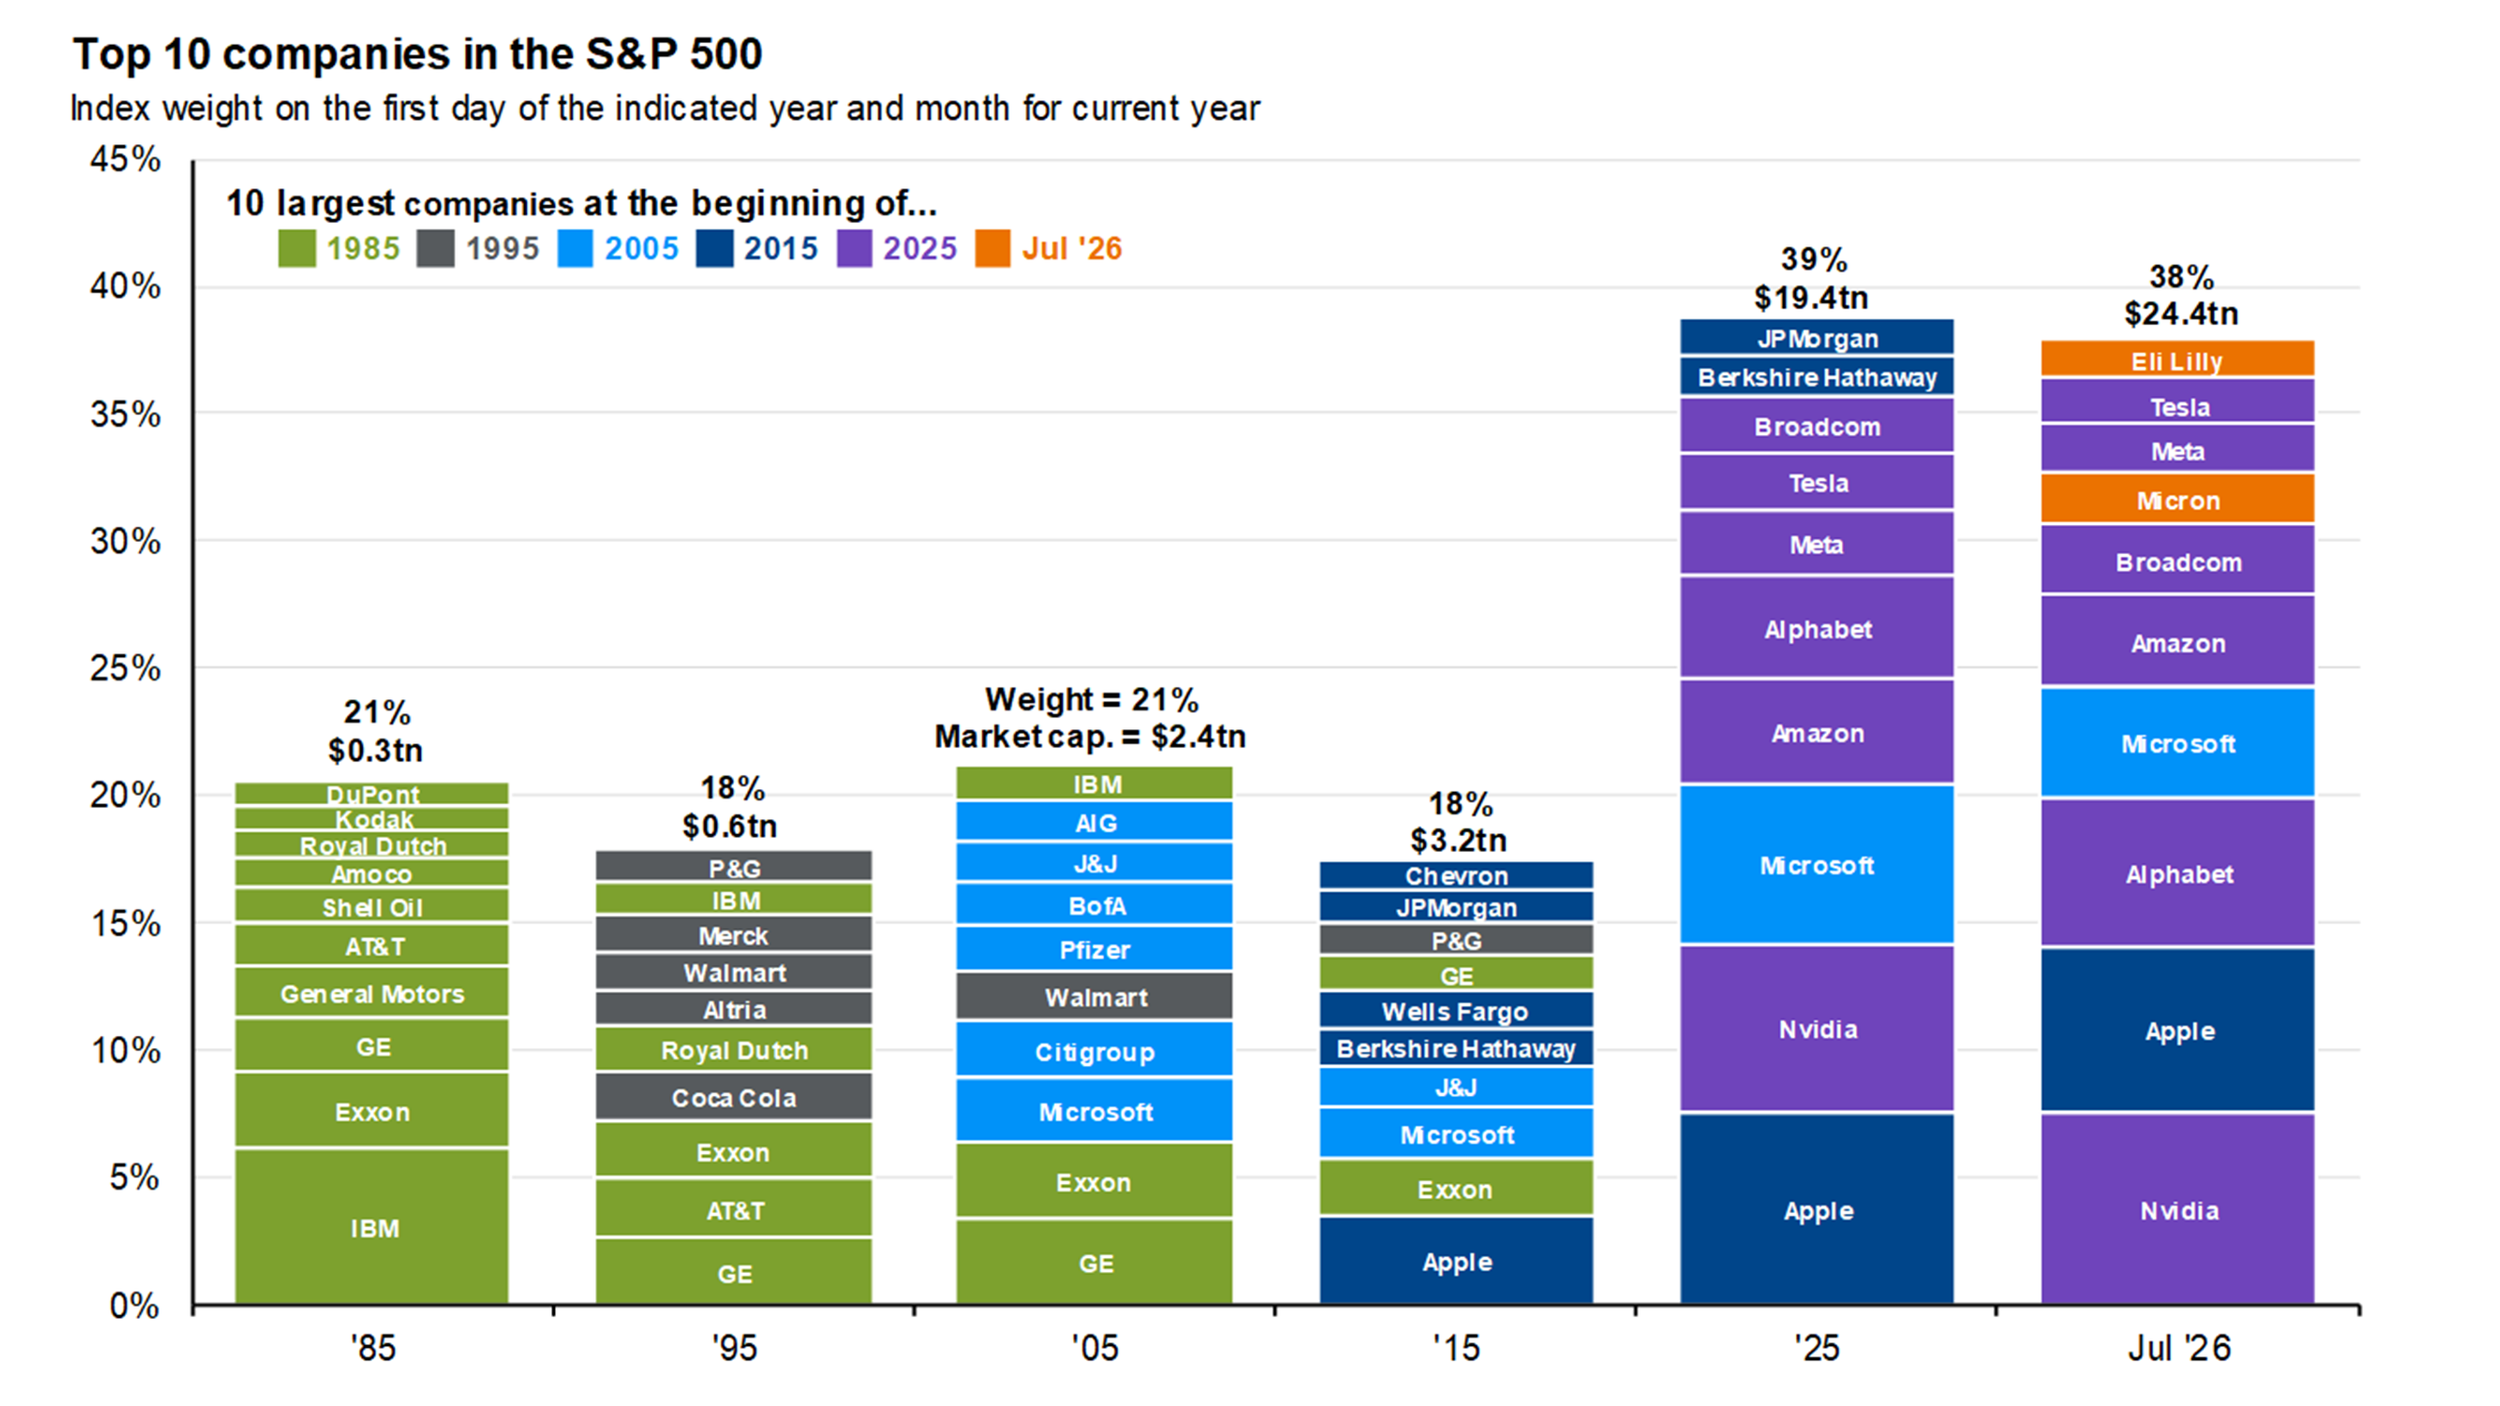
A great reminder of how difficult successful forecasting is can be seen from the illustration below. Today, it may seem obvious that certain companies, the Magnificent 7* for example, will be the clear winners in the AI race 10 years from now. But this is not the first time in history that investors have had to contend with a rapidly evolving new technology. Looking at the facts of history rather than the forecasts, we learn how difficult it is for companies in the U.S. to maintain market leadership for any extended period of time. As the chart shows, only ONE company (Apple) is still in the S&P 500’s top 10 that was in the group 11 years ago. Predictions are tough, especially about the future.
Asset Class Return Quilt
Source: Bloomberg, FactSet, Standard & Poor’s, J.P. Morgan Asset Management.
Investors often try to make the endeavor of investing more complex than it needs to be. Rather than relying too heavily on forecasts, chasing new and exciting investment opportunities, or subscribing to complex innovative strategies that promise short-term gains, focusing instead on the essential components of long-term investing - patience, discipline, diversification – and the primary drivers of long-term returns - fundamentals and valuations – has historically led to better investor outcomes.
*Magnificent 7 companies include: Amazon, Apple, Alphabet, Meta, Microsoft, Tesla, and Nvidia
Important Disclosures
Infinity Private Wealth LLC (“IPW”) is a Registered Investment Adviser registered with the State of Oklahoma. Registration as an investment adviser does not imply a certain level of skill or training, and the content of this communication has not been approved or verified by the SEC or by any state securities authority.
The information contained in this material is intended to provide general information about IPW and its services. It is not intended to offer investment advice. Investment advice will only be given after a client engages our services by executing the appropriate investment services agreement. Information regarding investment products and services are provided solely to read about our investment philosophy and our strategies. You should not rely on any information provided in this article in making investment decisions.
Market data, articles and other content in this material are based on generally-available information and are believed to be reliable. IPW does not guarantee the accuracy of the information contained in this material. This material may include forward-looking statements, which are not guarantees of future performance and involve risks and uncertainties.
Infinity Private Wealth LLC will provide all prospective clients with a copy of our current Form ADV, Part 2A (Disclosure Brochure) prior to commencing an advisory relationship. However, at any time, you can view our current Form ADV, Part 2A at adviserinfo.sec.gov. In addition, you can contact us to request a hardcopy.