
Q1 2026 Capital Market Update: Everything, Everywhere, All at Once
April 21, 2026

by Bradley Wallace, CFA®
"Some things are so unexpected that no one is prepared for them." - Leo Rosten
What a year the first quarter of 2026 has been. For capital markets, the first three months have felt like a full twelve as geopolitical conflict drove oil prices up more than 70%, several software-related companies fell into a bear market as the adoption of AI called to question their long-term value, and monetary policy expectations virtually reversed.
On the first page of our 2026 outlook paper, we mentioned three primary areas of uncertainty that we thought investors would have to contend with throughout the year: economic growth (labor, inflation and monetary policy), the rapid evolution of Artificial Intelligence, and geopolitics. The first quarter brought all of these, everywhere, all at once, presenting real challenges for those who may have been overexposed to certain areas of the market. On the other hand, this “all at once” environment has created potential opportunities for investors who were diligent in their risk management approach coming into the year, and who have maintained the discipline needed to find value in the market’s dislocation.
Many cliches exist on how to prepare for uncertainty as an investor – such as “expect the unexpected” and “markets climb a wall of worry” - but when all of these materialize at once, it can create a highly uncomfortable environment for investors of all kinds. The past three months have felt this way. But during these uncomfortable periods, historical perspective is a valuable reminder that times like these are relatively common throughout financial history.
Since 1928, the S&P 500 has fallen by more than 10% 56 times and more than 20% 22 times (see chart below). That means market corrections (-10% decline) occur about once every two years and bear markets (-20% decline) occur about once every 4.5 years. Each time there has been a different catalyst, just like this time. And each time the market has eventually recovered, rewarding those with the fortitude to stick to their strategy.
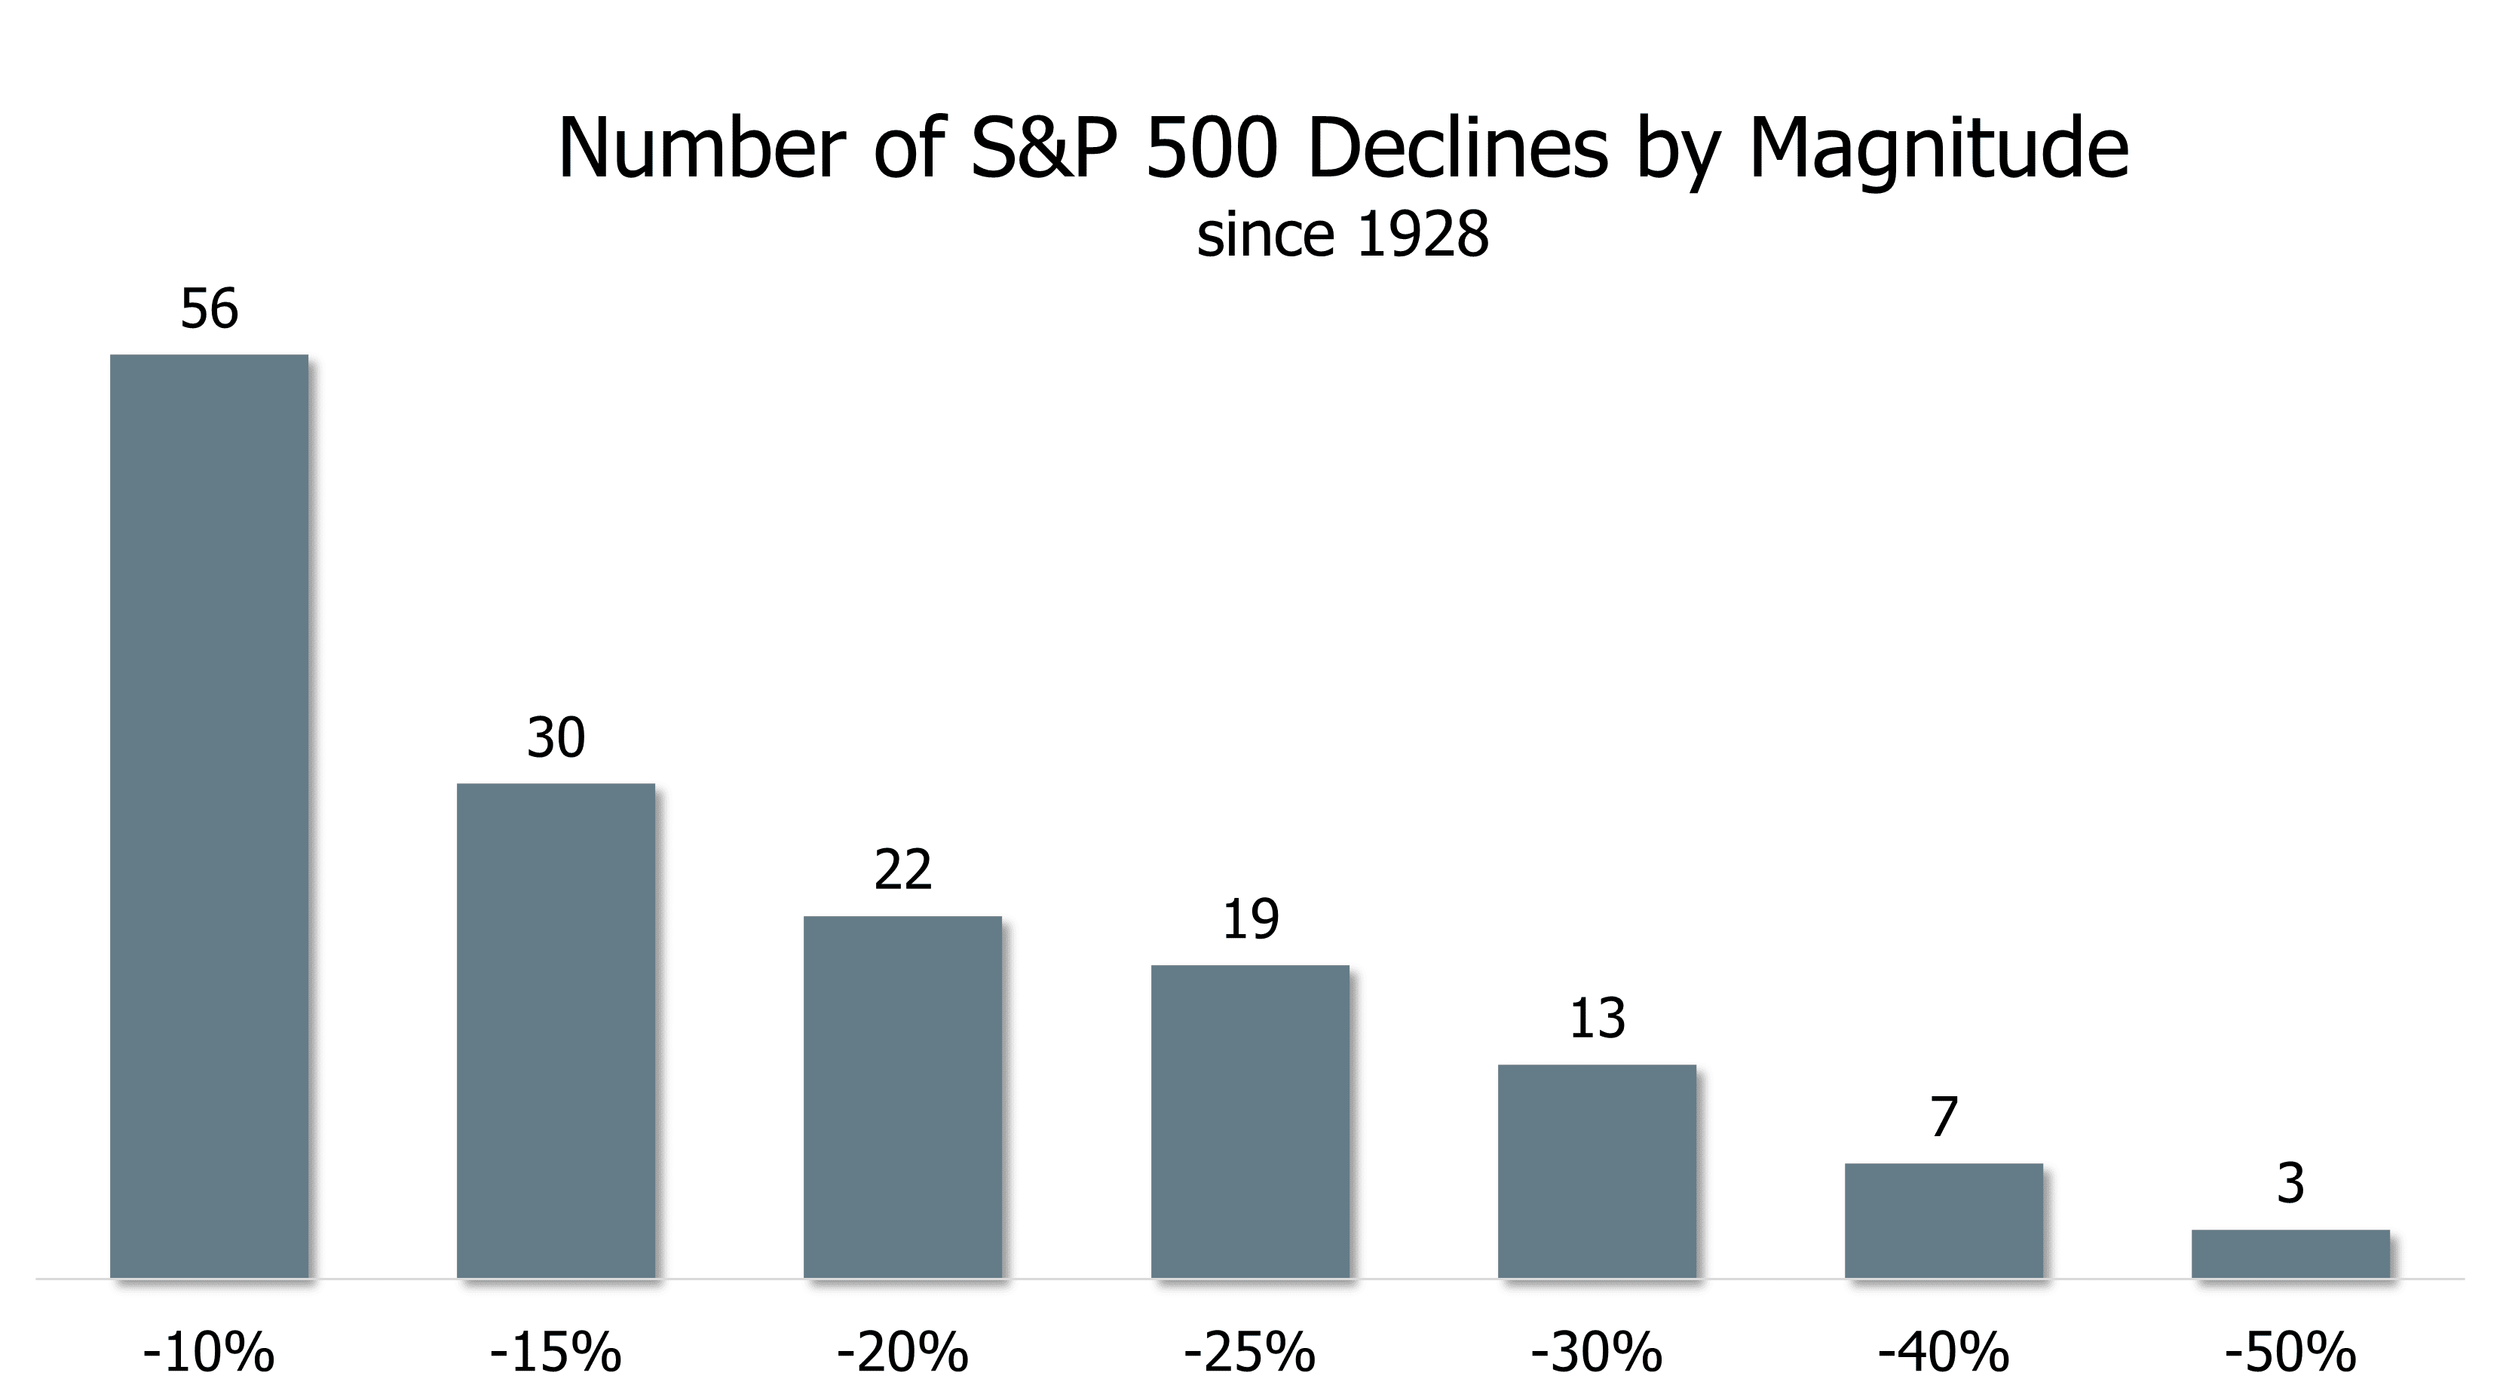
Source: Ritholz Wealth Management, data via Bloomberg Finance L.P.
Changing Directions
Inflation expectations rose sharply in the first quarter as crude oil prices increased by nearly 75% over the three-month period. A direct result of the geopolitical conflict in Iran, an estimated 8 million barrels per day of oil is expected to be cut from global supply as the Strait of Hormuz - one of the most active waterways for oil transportation – was effectively shut down. According to the International Energy Agency, this will go down as the largest disruption to global oil markets in history, with other notable disruptions shown in the table below to add historical perspective.
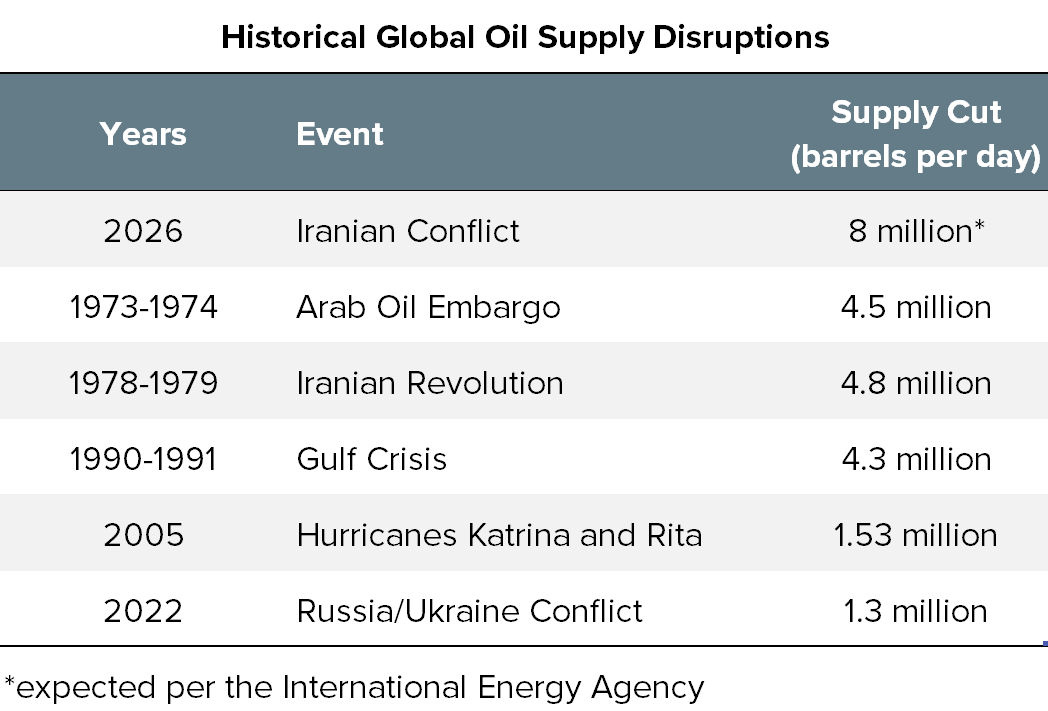
Source: Reuters, March 13, 2026
The magnitude of this year’s historic disruption can feel discouraging, and rightfully so. But perhaps encouraging is the fact that all of these historical disruptions were eventually resolved, and there’s little reason to believe this time will be different. However, timing is always the unknown variable.
Inflation expectations also rose along with (or because of) oil prices. Energy tends to be the most volatile component of inflation measures, along with food, which is often reliant upon other commodities. This is well-illustrated in the chart below, with energy represented by the gray bars and food by the light blue. A more smoothed gauge of consumer prices is core inflation (or total inflation less food and energy), which give economists and policy makers a better idea of what’s likely to weigh on consumer spending longer.
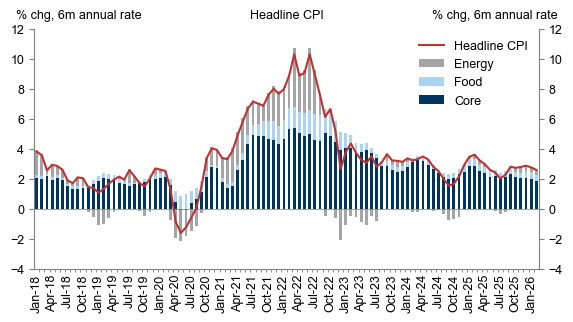
Source: Goldman Sachs
But expectations are simply that, and historically consumers have expected higher inflation than what ultimately materialized (see chart directly below). Also, during highly-volatile inflation periods, no one expected near the inflation levels that arose.
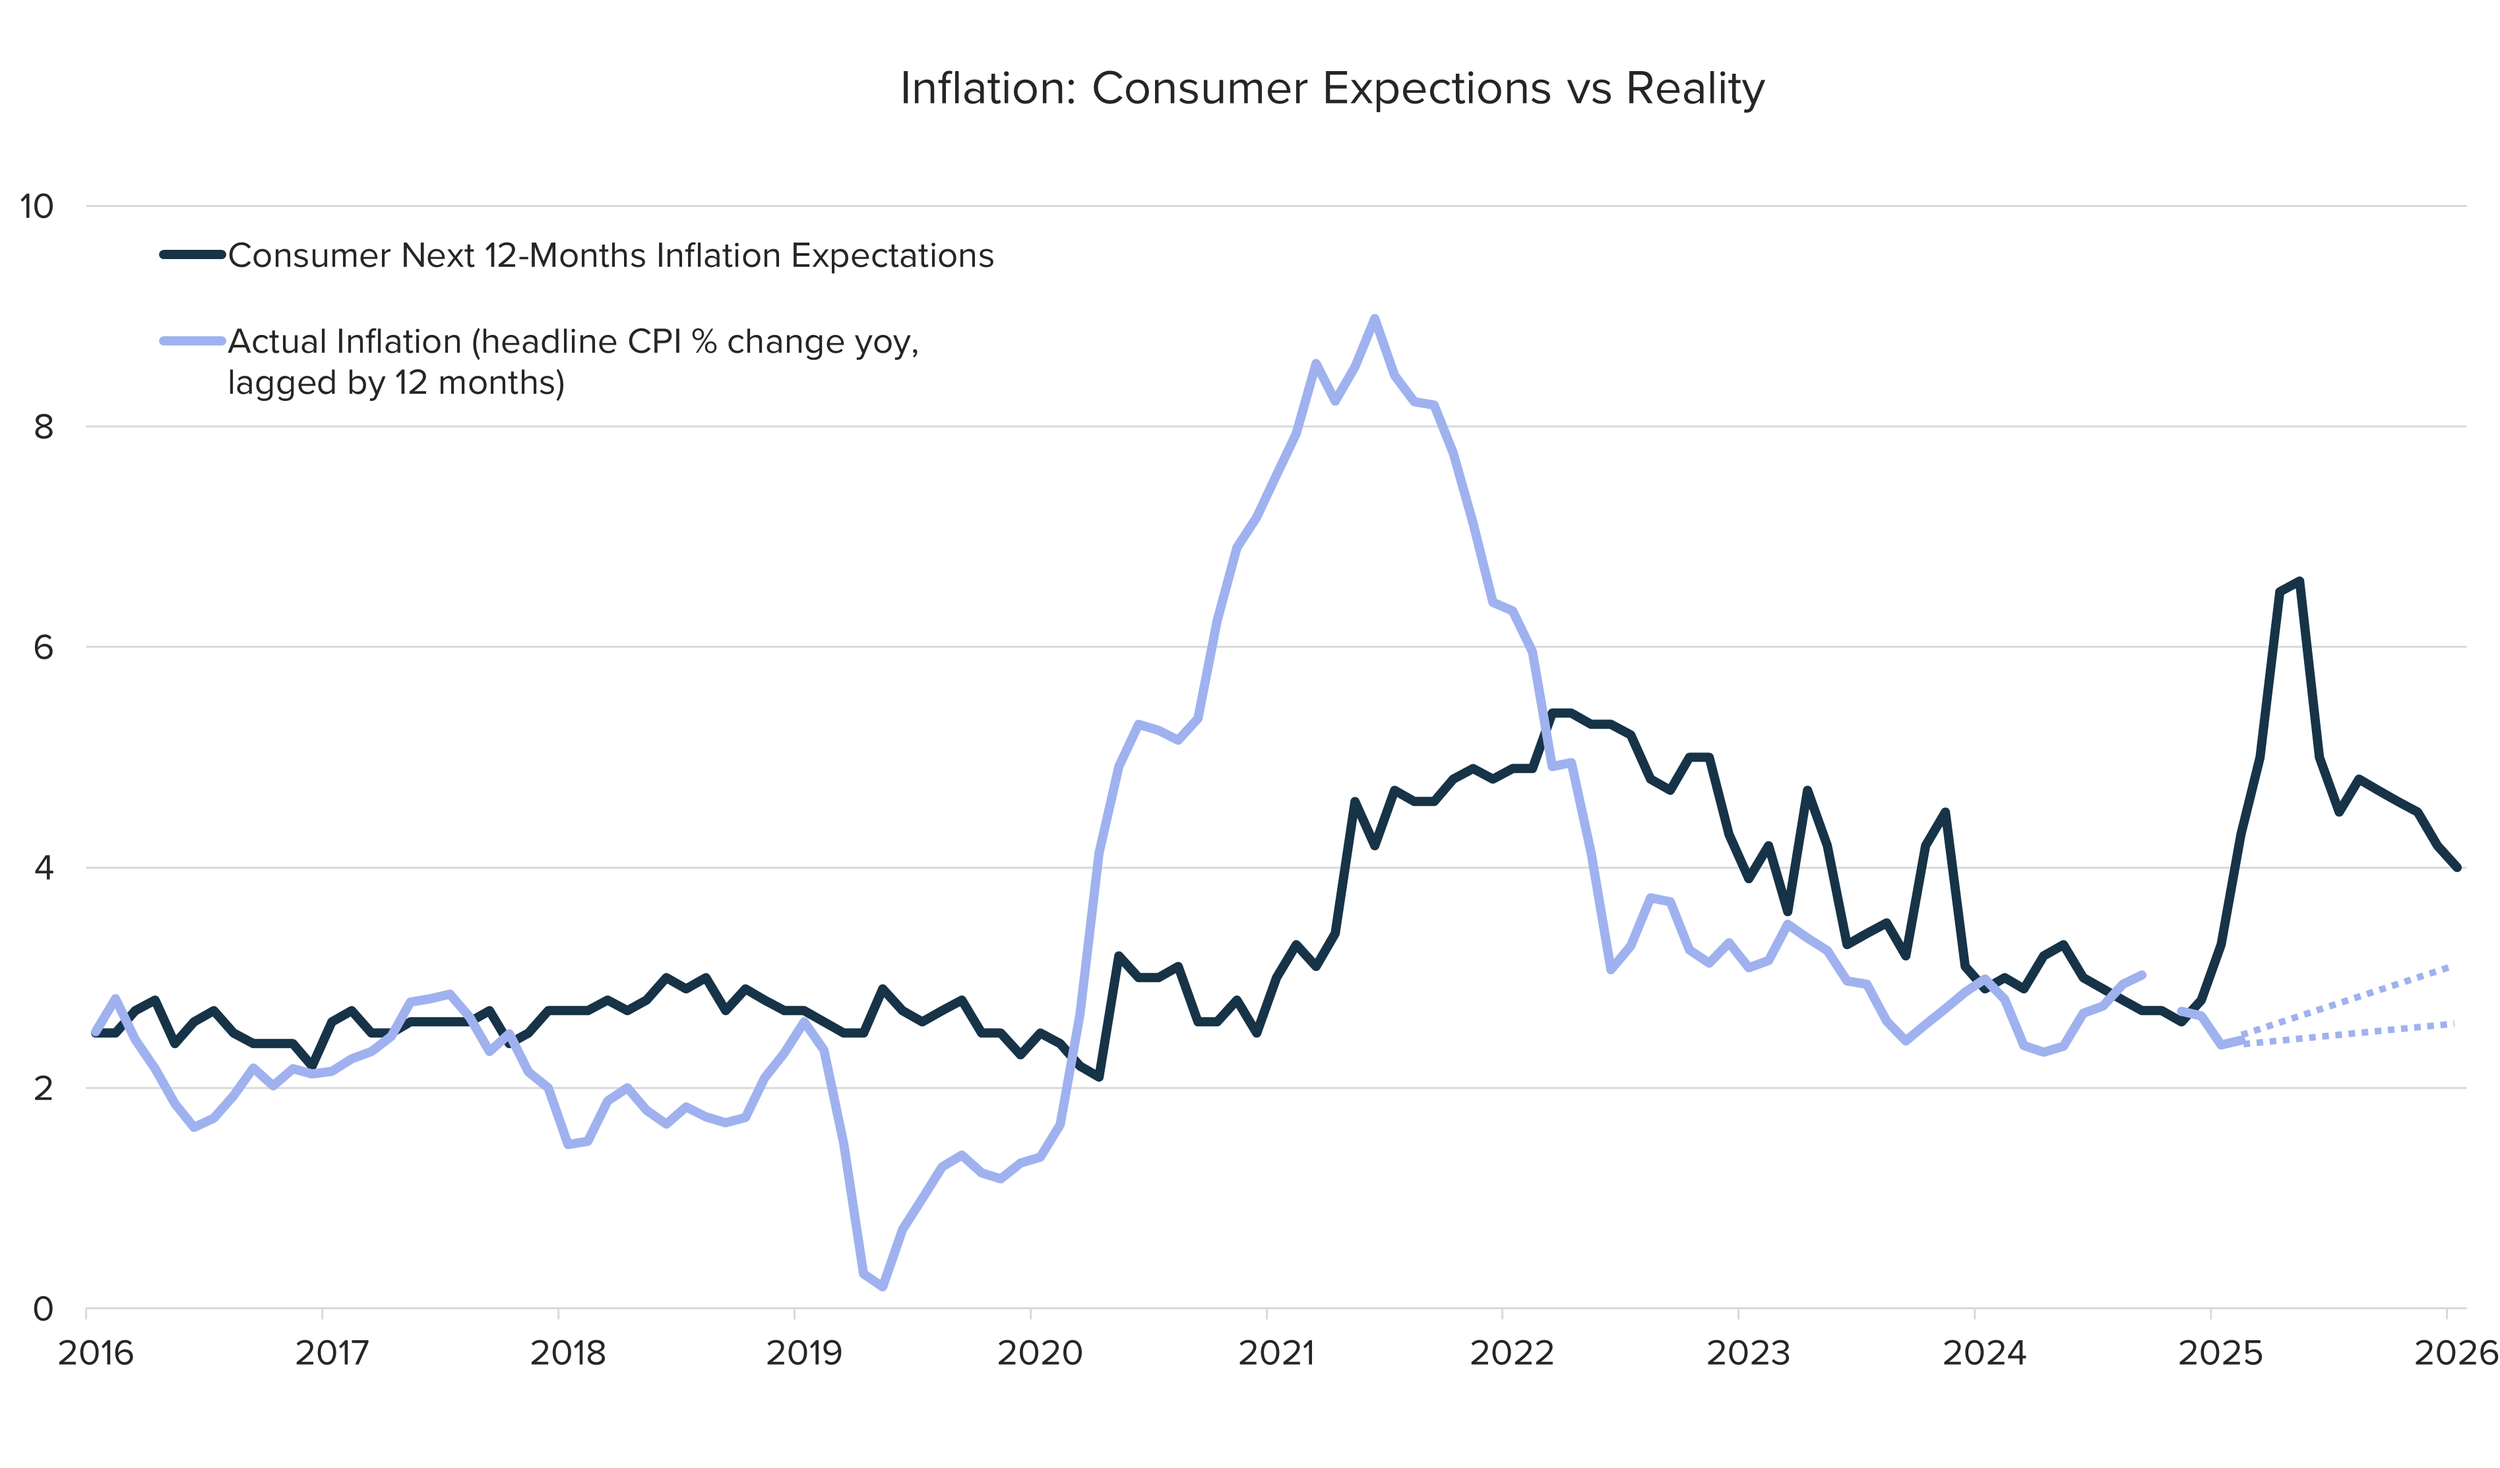
Source: Infinity Private Wealth, Federal Reserve Bank of St. Louis
As a result of higher expected inflation, monetary policy makers left interest rates unchanged through both meetings in the first quarter. This was a clear change of direction from market expectations, as illustrated by the colorful probabilities chart below, which shows the probability-weighted expectations for the Fed Funds rate as of December 2026, tracked over the past six months. In November 2025, markets fully expected the Federal Reserve to continue cutting rates through 2026, with rates ending this year solidly below their current level. However, the roughly equal split between colors through most of the chart indicates that the exact level of rates had a fairly equal weighting.
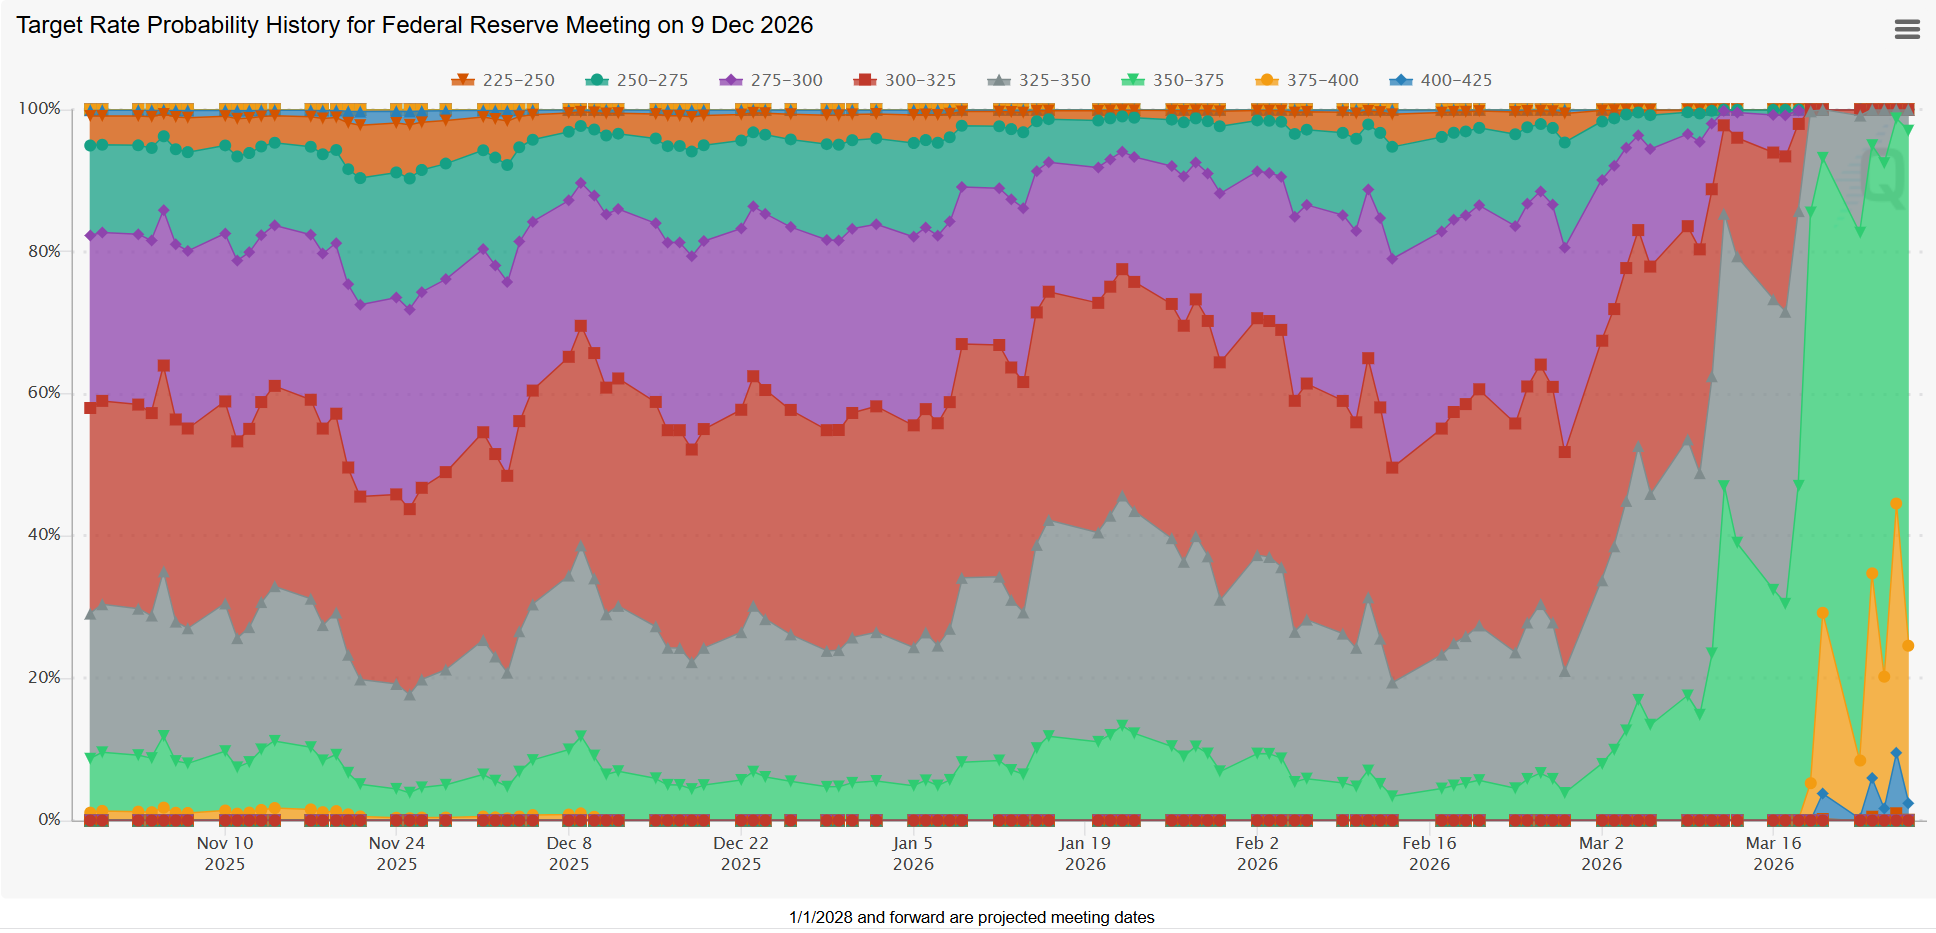
Source: CME Group, FedWatch Tool
That expectation changed sharply in Q1, with investors and economists now expecting rates to remain at their current level all year, and potentially even higher, should the geopolitical conflict and elevated energy prices linger. Time will tell, but prudent risk management and thoughtful asset allocation will remain critical for investors in the interim.
Higher Yields and Tax-Exempts
Fixed income has provided somewhat of a ballast to multi-asset portfolios – that is, portfolios diversified across stocks, bonds, cash and other asset types – throughout the first quarter of 2026. While stocks are broadly negative year-to-date, fixed income has remained mostly flat over that same period. This “flat-ish” year-to-date return has been due to offsetting return attributes within the asset class. In general, fixed income, or bonds, provides investors with a return on their investment in two ways; first, and most obviously, is the income component, which is the interest paid to the bondholder at regular intervals.
The second source of return is the appreciation (or depreciation) of the bonds’ value, which can be driven by the level of prevailing interest rates, supply/demand dynamics, or changes to the underlying fundamentals of the issuer. Nonetheless, bond values are often inversely correlated to changes in interest rates. As rates moved upward in the first quarter of the year, existing fixed income assets became slightly less valuable as higher-yielding new bonds were becoming available. Although fixed income as an asset class began the year with relatively attractive income yields, that income component was largely, if not fully, offset by the bonds’ declining market value.
The good news, as is often the case when interest rates rise, is that investors deploying cash today in most fixed income classes are able to do so at otherwise higher starting yields than existed three months ago, which means more income generated per dollar invested. Of course, these environments could reverse as quickly as they came, increasing the need for adaptive management.
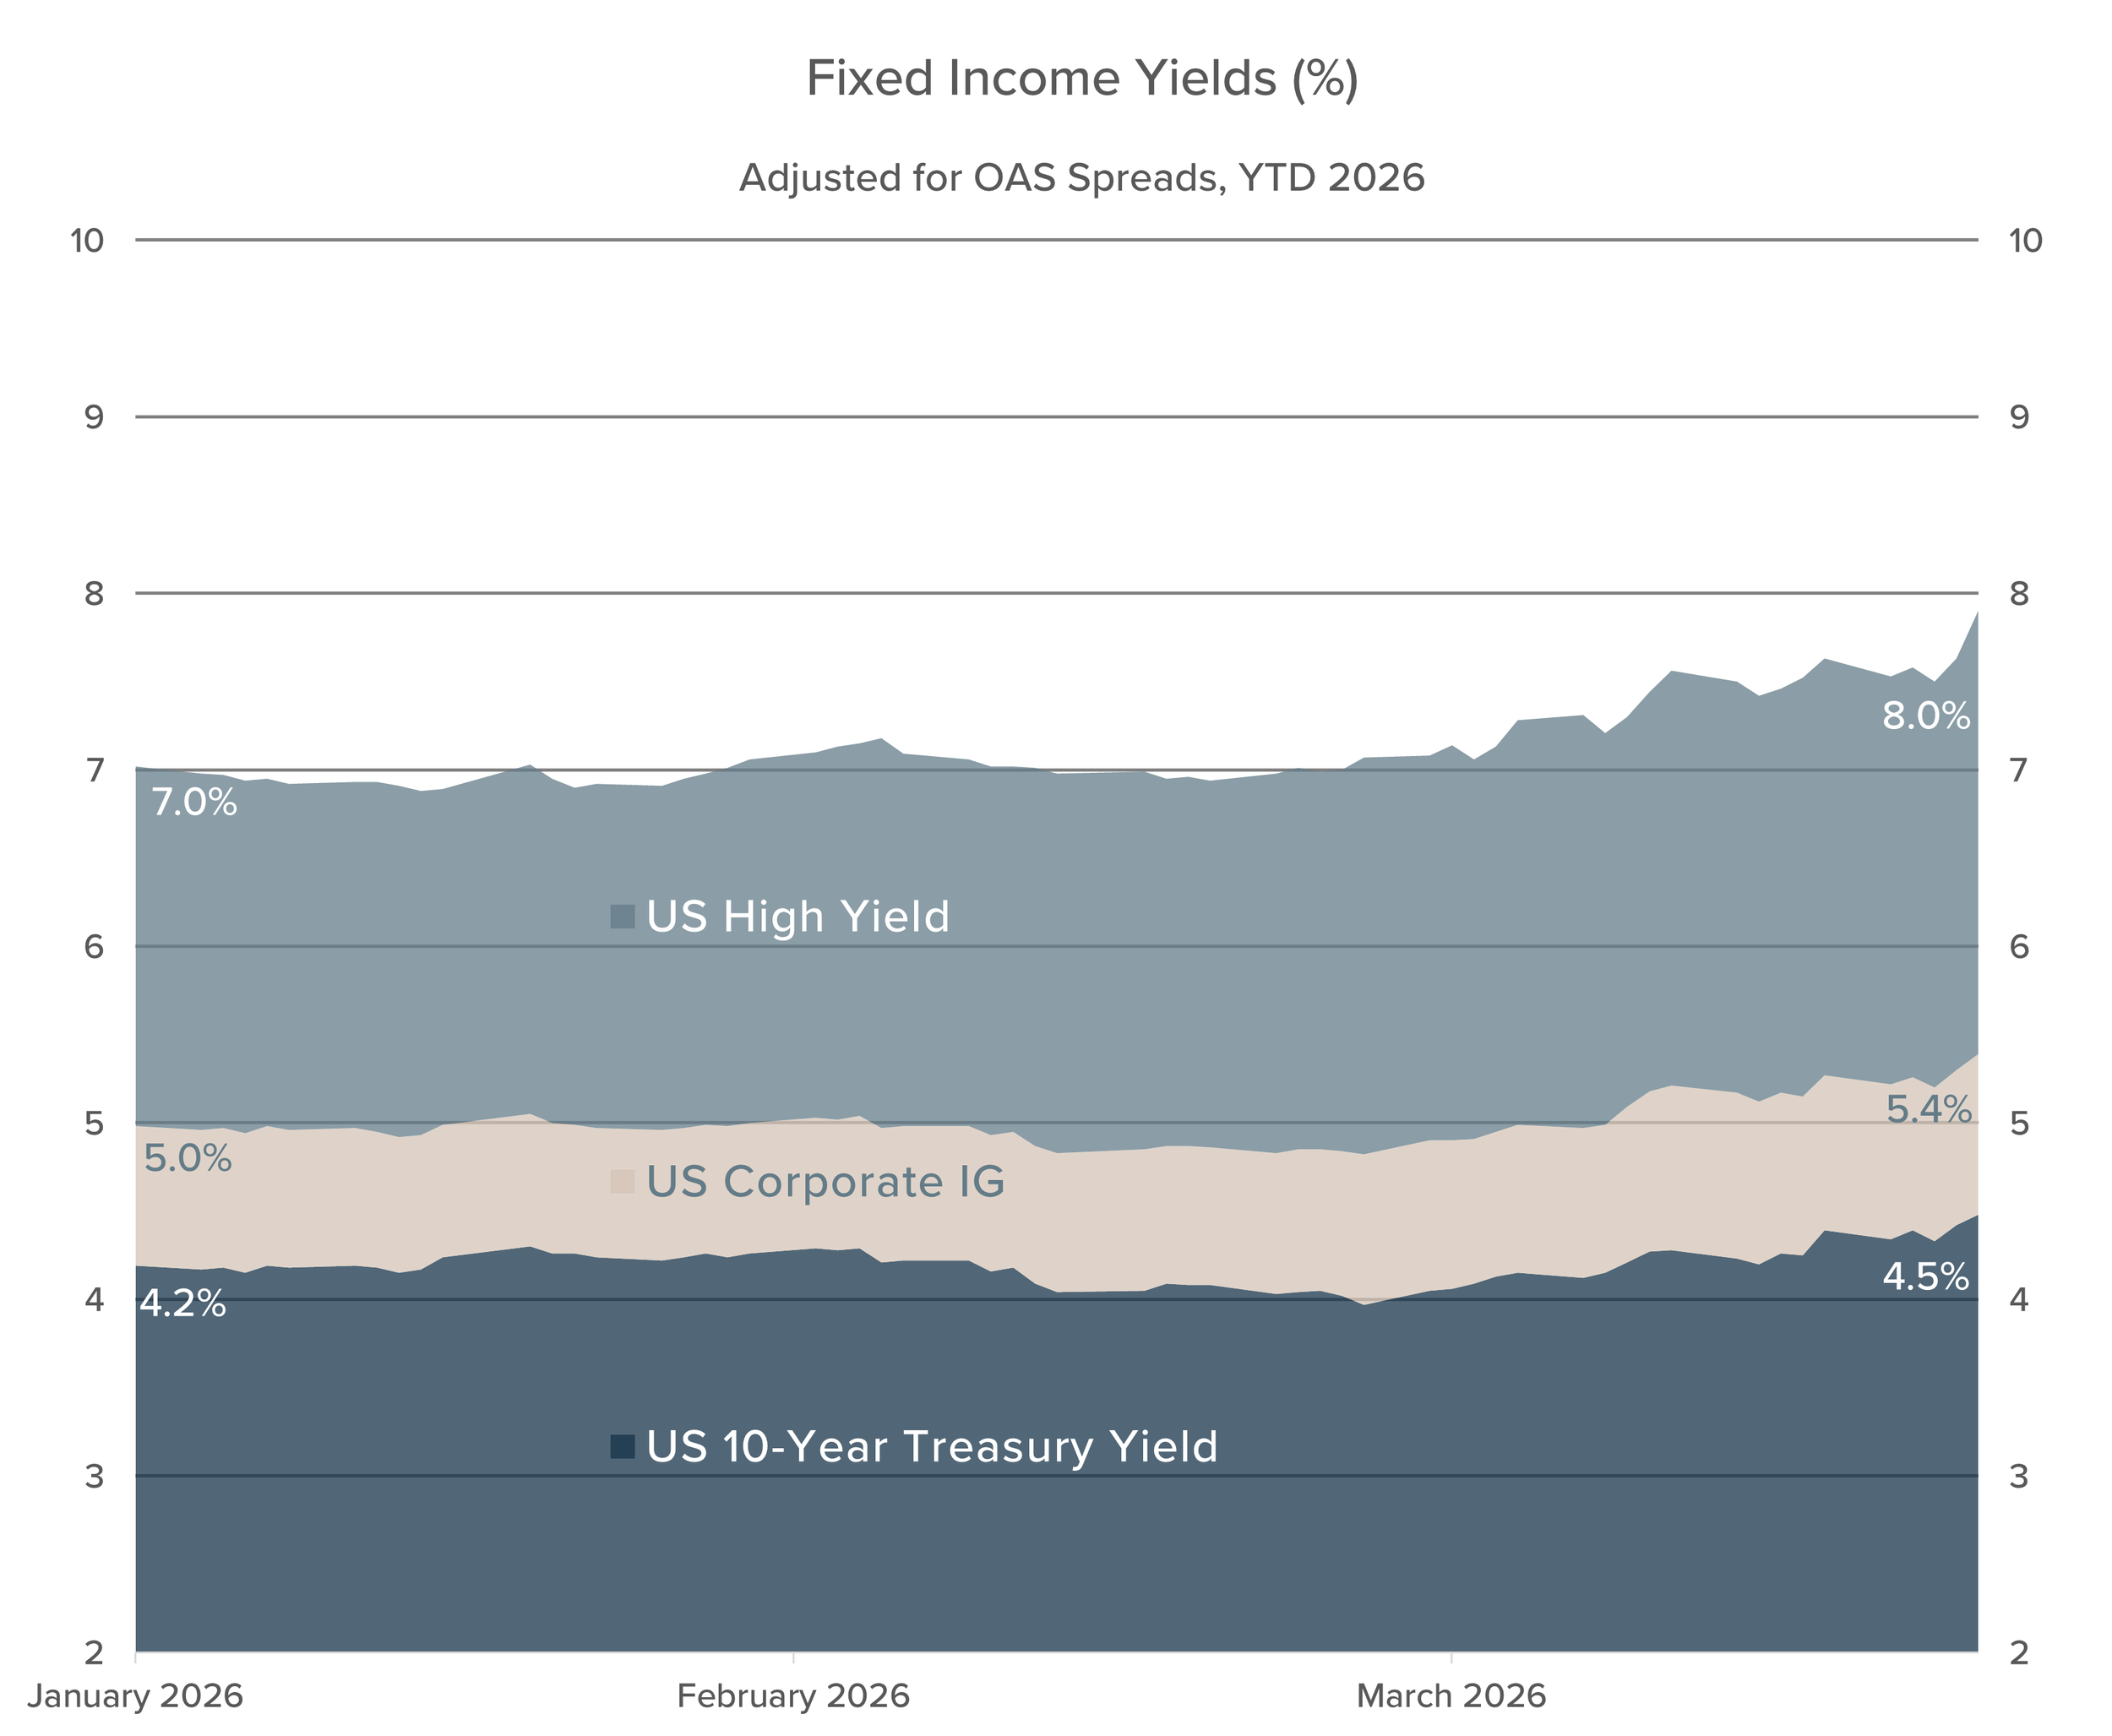
Source: Infinity Private Wealth, Federal Reserve Bank of St. Louis
Looking more specifically at the tax-exempt segment of the bond market, municipal bond yields are near the upper end of their 15-year range on a tax-equivalent basis. Tax-equivalent yields are simply a way to compare taxable bond yields to tax-exempt yields in a more apples-to-apples manner, with the math being [tax-exempt yield / (1-tax bracket)]. In other words, if an investor in a given tax bracket were to purchase both a taxable bond and a tax-exempt bond, how comparable would their after-tax income be. Current tax-equivalent yields can be seen in the chart below, whereas the second bar from the left represents the municipal bond market.
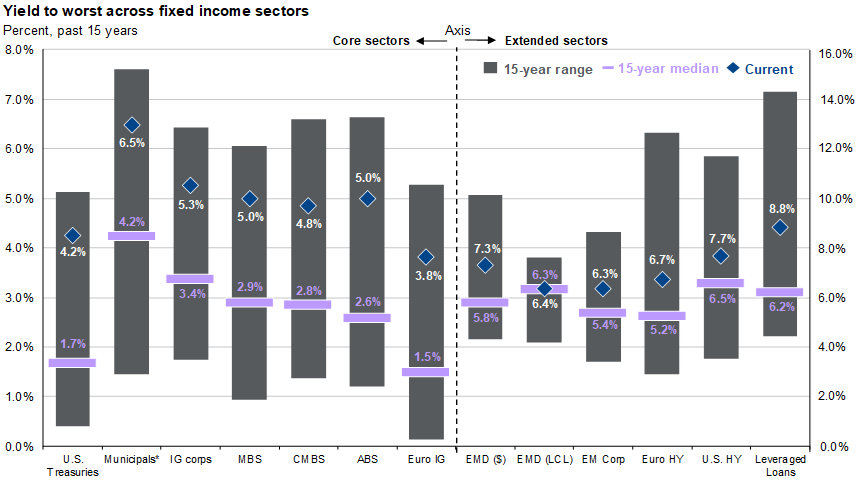
Source: Bloomberg, FactSet, J.P. Morgan Credit Research, J.P. Morgan Asset Management
Currently, investors with high taxable income who are in the top bracket (37%, plus 3.8% Medicare tax) could see tax-equivalent yields near 6.5%, which is 50% higher than the past 15-year median level. As they say, it’s not what you earn that matters, it’s what you keep; after-tax investment returns are what investors ultimately keep.
Looking ahead to the rest of the year, investor expectations seem to lean toward higher policy rates as inflation concerns are worked out. But if economic activity cools and inflation remains contained, the Federal Reserve could resume their interest rate cutting program, providing a potential tailwind to fixed income investors.
A Picker’s Market
As this is being written on the final day of the quarter, equity markets are rebounding sharply (S&P 500 +2.9% today) to cap off an otherwise abysmal start to the year. While headlines will attribute virtually all of the recent equity market drawdown to geopolitical conflict in the Middle East, these broad-based market declines are very rarely caused by a single factor. And sometimes the primary catalyst is no real catalyst at all, but instead certain areas of the market simply became overvalued and were due for a recalibration. Mr. Market, as value investors Ben Graham and Warren Buffett would refer to the overall public equity market, is almost always either overly optimistic or irrationally pessimistic about future economic prospects. The key for long-term investors is to filter through this irrationality, understand what may fundamentally hinder their investment strategy and, opposite, what will likely be a blip in the plan a few short years from now. This is not to say that real issues are not at stake around the world, but it is to say that maintaining perspective is critical during times of uncomfortable uncertainty.
Another clear issue impacting equity markets so far in 2026 is the rapid evolution and adoption of Artificial Intelligence, as we touched on in our annual outlook a few months ago. The disruptee in Q1 has been software-related companies, which have significantly underperformed the broader market over the past three months (chart below).
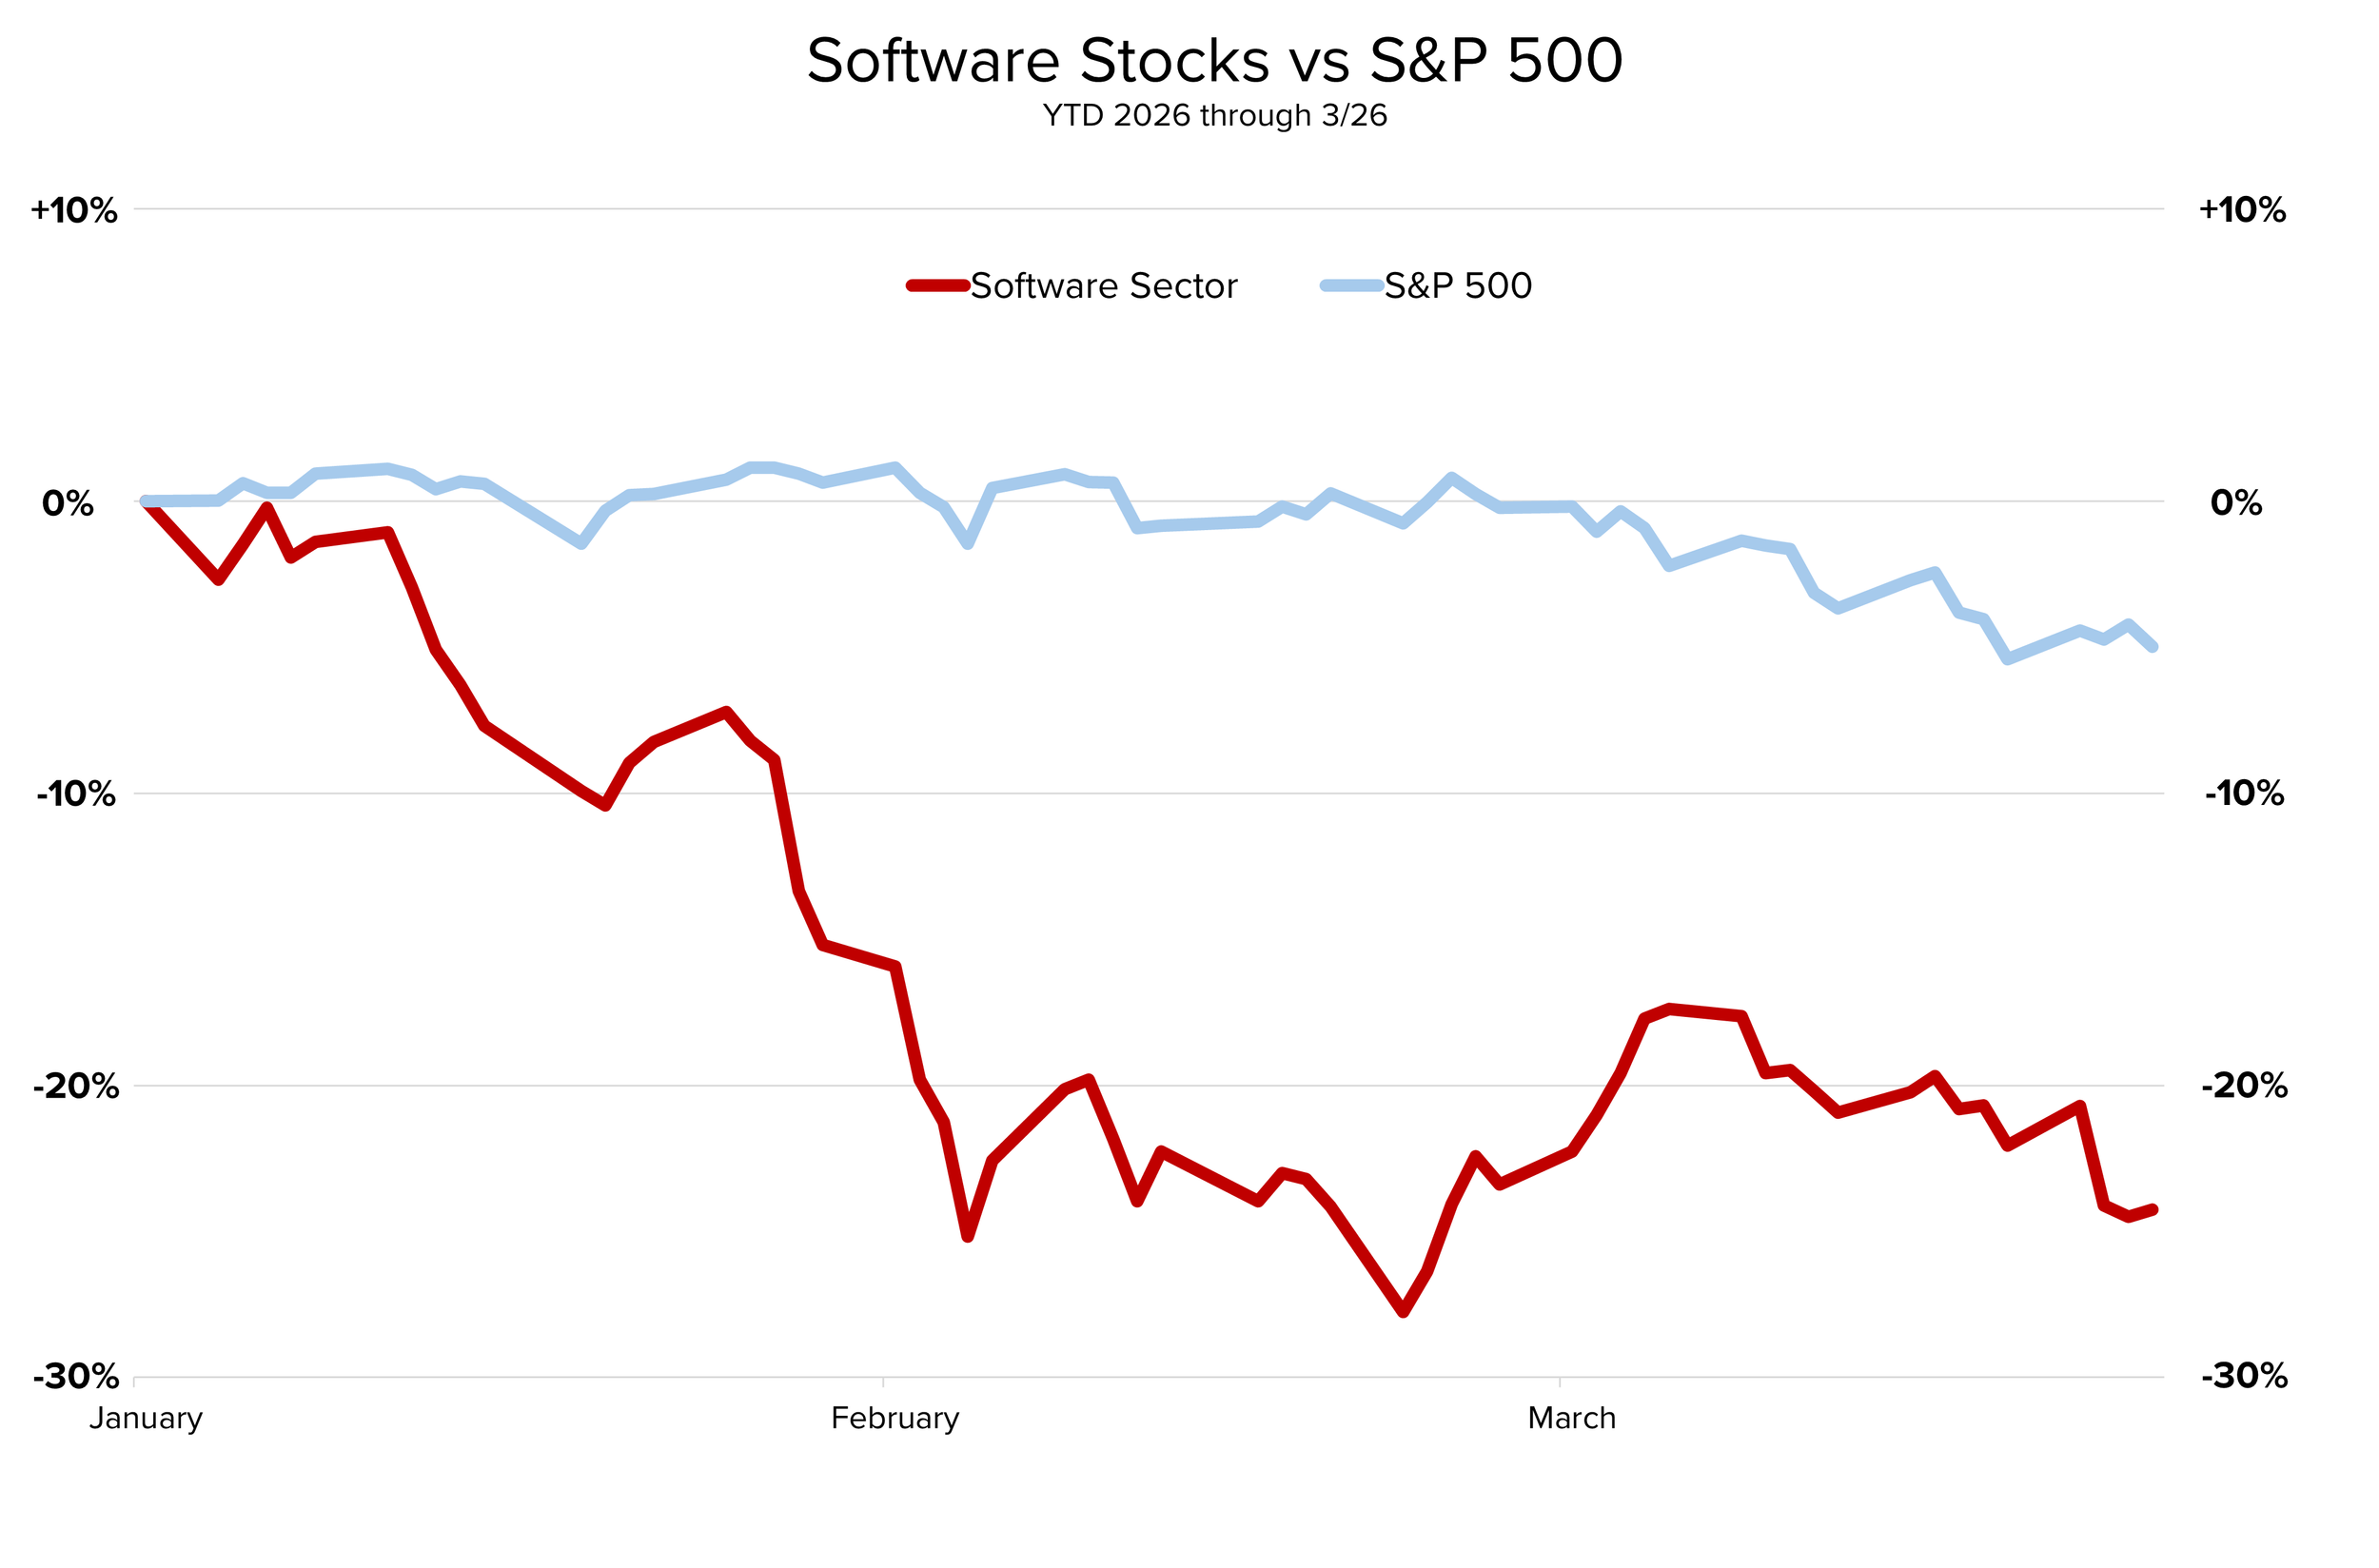
Source: Infinity Private Wealth, Yahoo Finance. Software sector represented by iShares Expanded Tech-Software ETF (IGV). Price change only, does not account for dividends.
Opposite software, the energy sector is up more than 41% year-to-date through March 30, as oil prices surpassed $100/barrel and energy constraints linger on.
Along with the wide dispersion between inter-sector returns so far this year - ie software down 25% and energy up 40% - the difference between individual stock returns has also been unusually wide. This level of dispersion has historically been more favorable to fundamentals-based active managers than has been the case with more synchronous markets where all stocks tend to move together. Some might refer to these high-dispersion environments as a “stock picker’s market,” but I think a better label is a “business picker’s” market, as Buffett described he and Charlie Munger in his 2022 shareholder letter. Approaching stocks for what they really are - real businesses, producing real value, by real people – is a much more constructive way to own a diversified basket of equities, especially in times of turmoil. To that end, these “business picker” environments can present opportunities for disciplined investors to add long-term value.
Internationally, the global equity selloff in Q1 also moderated non-U.S. equity valuations following a multi-quarter run of relative outperformance. Zooming out, there still seems to be reasonable entry points for globally-diversified equity investors, as the gap between U.S. and international equity valuations remains historically wide. As shown in the chart below, which measures the U.S. CAPE (cyclically-adjusted price-to-earnings) ratio relative to the Non-U.S. CAPE ratio, equity market valuations in non-U.S. markets have remained significantly lower than in domestic markets. The question remains whether or not the reversion that began last year will persist, or if investors will continue to assign a significant premium valuation to companies in the U.S. relative to their international peers.
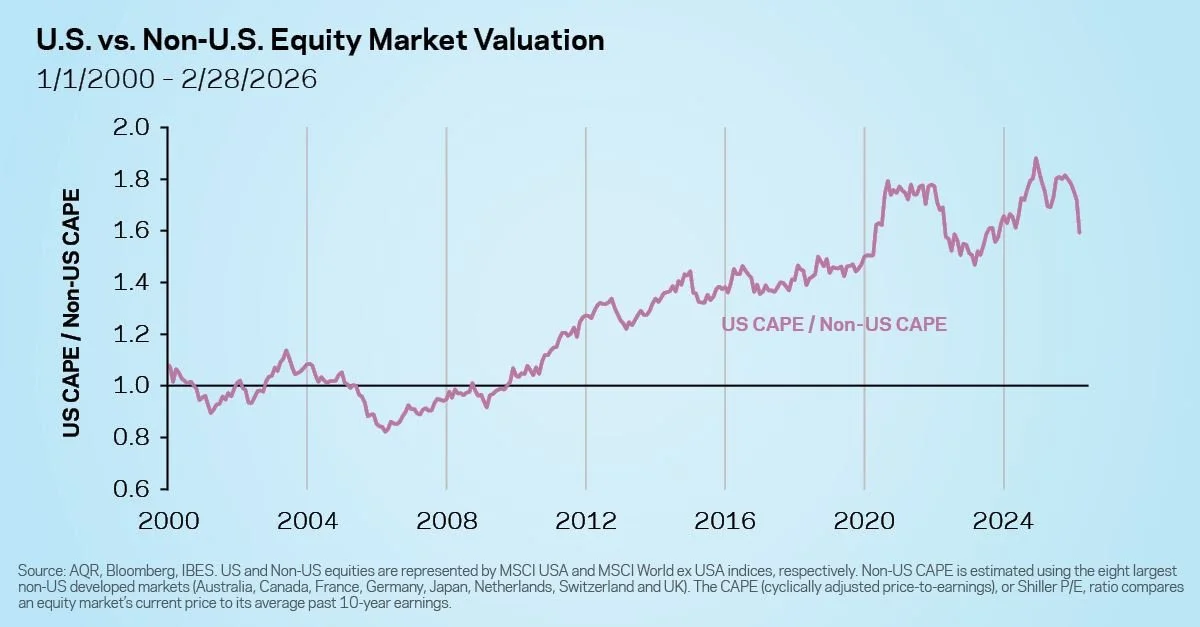
Source: AQR, Bloomberg, IBES
The Case for Diversification
Market volatility is uncomfortable, and stocks hardly ever enter a correction when everything around us is going great. There is almost always something simultaneously happening economically, geopolitically, or technologically that is causing uncertainty and discomfort in the world. In the first three months of 2026 it was the Middle East conflict, rising energy prices, higher inflation, and rapid AI adoption that seems sure to create some level of job displacement. So, at the same time investors are experiencing real-world uncertainties, investment portfolios are also experiencing higher volatility. And with no clear end in sight to some of these widespread events, it can be difficult to maintain investment discipline when emotions may be screaming to abandon ship. But many of us know this is precisely the wrong time to make long-term decisions based on short-term factors. Again, that’s not to make light of the current geopolitical and macroeconomic challenges; these are real issues. At the same time, two important statistics have endured throughout history: 1) Historically, similar geopolitically conflicts have eventually come to an end and 2) according to research produced by JP Morgan, since 1950, a diversified 60/40 stock/bond portfolio has produced a positive return in every rolling 5-year period.*
For many wealth creators, the key to building generational wealth is taking calculated risks, concentrating your time and capital into a single endeavor. But staying wealthy and ensuring legacy continuity often requires a different approach; one focused on wealth preservation, purchasing power protection and efficient generational transfer. The fundamental ingredients for building wealth and keeping wealth are different, wherein the latter prudent risk management through thoughtful diversification becomes the driver, rather than excess risk and portfolio concentration.
Strengthening the case for diversification is one of my favorite charts (below) which highlights the wide variety of asset class leaders on a year-by-year basis versus the relative consistency of a more diversified portfolio across the same period. The far-left-hand column shows the annualized returns for each asset class from 2011-2026 YTD (through March 30th). Interestingly, although large cap equities have significantly outperformed all other asset classes on an annualized basis over this period, they were only the leading asset class in three of the sixteen calendar years, less than 20% of the time. For human investors, the investor returns matter more than the investment returns. Similar to the adage that it’s not what you earn that matters, it’s what you keep; it’s not the return of an individual stock or bond that matters, it’s the return that your actual strategy provides. Investor psychology can be a feature or a bug, depending on how it’s managed.
At Infinity Private Wealth, our focus remains on building resilient portfolios designed to navigate environments like these.
*Source: JPMorgan Asset Management. Assumes annual rebalancing. Stocks: S&P 500; Bonds: Strategas/Ibbotson for periods prior to 1976 and the Bloomberg U.S. Aggregate thereafter. Past performance does not guarantee future results. Diversification does not ensure protection against loss.
‘
Asset Class Return Quilt
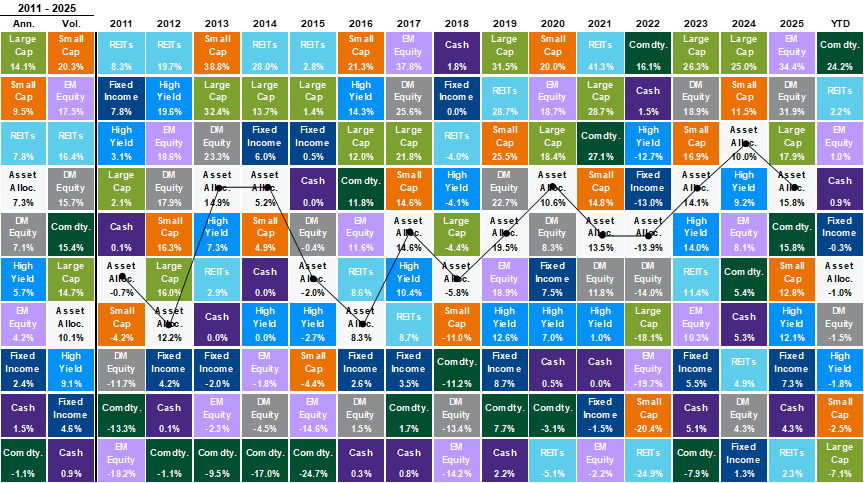
Source: Bloomberg, FactSet, MSCI, NAREIT, Russell, Standard & Poor's, J.P. Morgan Asset Management