October 16, 2026

by Bradley Wallace, CFA®
“Know what you own, and know why you own it.” - Peter Lynch
On April 29, 2000, Berkshire Hathaway shareholder Gaylord Hanson stood up at the company’s annual meeting and suggested that both Warren Buffett and Charlie Munger deserved “10 lashes with a wet noodle” after the company’s abysmal 1999 return relative to the S&P 500. That year, Berkshire’s stock was down 19.9% while the S&P 500 was up 21%, a relative underperformance of 40 percentage points. Tech stocks were up even more, climbing 65% in 1999, 85 percentage points more than Buffett’s loyal investors received.
Gaylord Hanson continued, claiming that technology stocks seemed to be the “only play in town” and that he had made more than 100% on his aggressive technology investments in 1999. The “old economy” companies that Berkshire owned were considered a thing of the past. Finally, Hanson finished by pleading with Warren and Charlie: “Are we asking too much as shareholders of Berkshire Hathaway for you men to put your brains to work and possibly speculate a little bit, maybe 10 percent of our money…” Buffett replied simply and without hesitation, “The answer is we will never buy anything we don’t think we understand.”
Of course, the following three years were among the worst in stock market history, with technology stocks leading the decline as the exuberance faded. Over the next 10 years Berkshire’s stock recovered strongly, producing a cumulative return more than 40 percentage points greater than the S&P 500 over that decade. Remarkably, if Berkshire’s stock were to fall 99% today its cumulative return would still have outperformed the S&P 500 since 1965.¹
While there are obvious differences between today’s market environment and 1999, the feeling of “the only play in town” seems to be resurfacing with the amount of investor capital chasing AI-related investments. Perhaps the best lesson from historic market cycles is to invest in what you understand – own what you know, know why you own it, and focus on the only play in town that matters: your own goals.
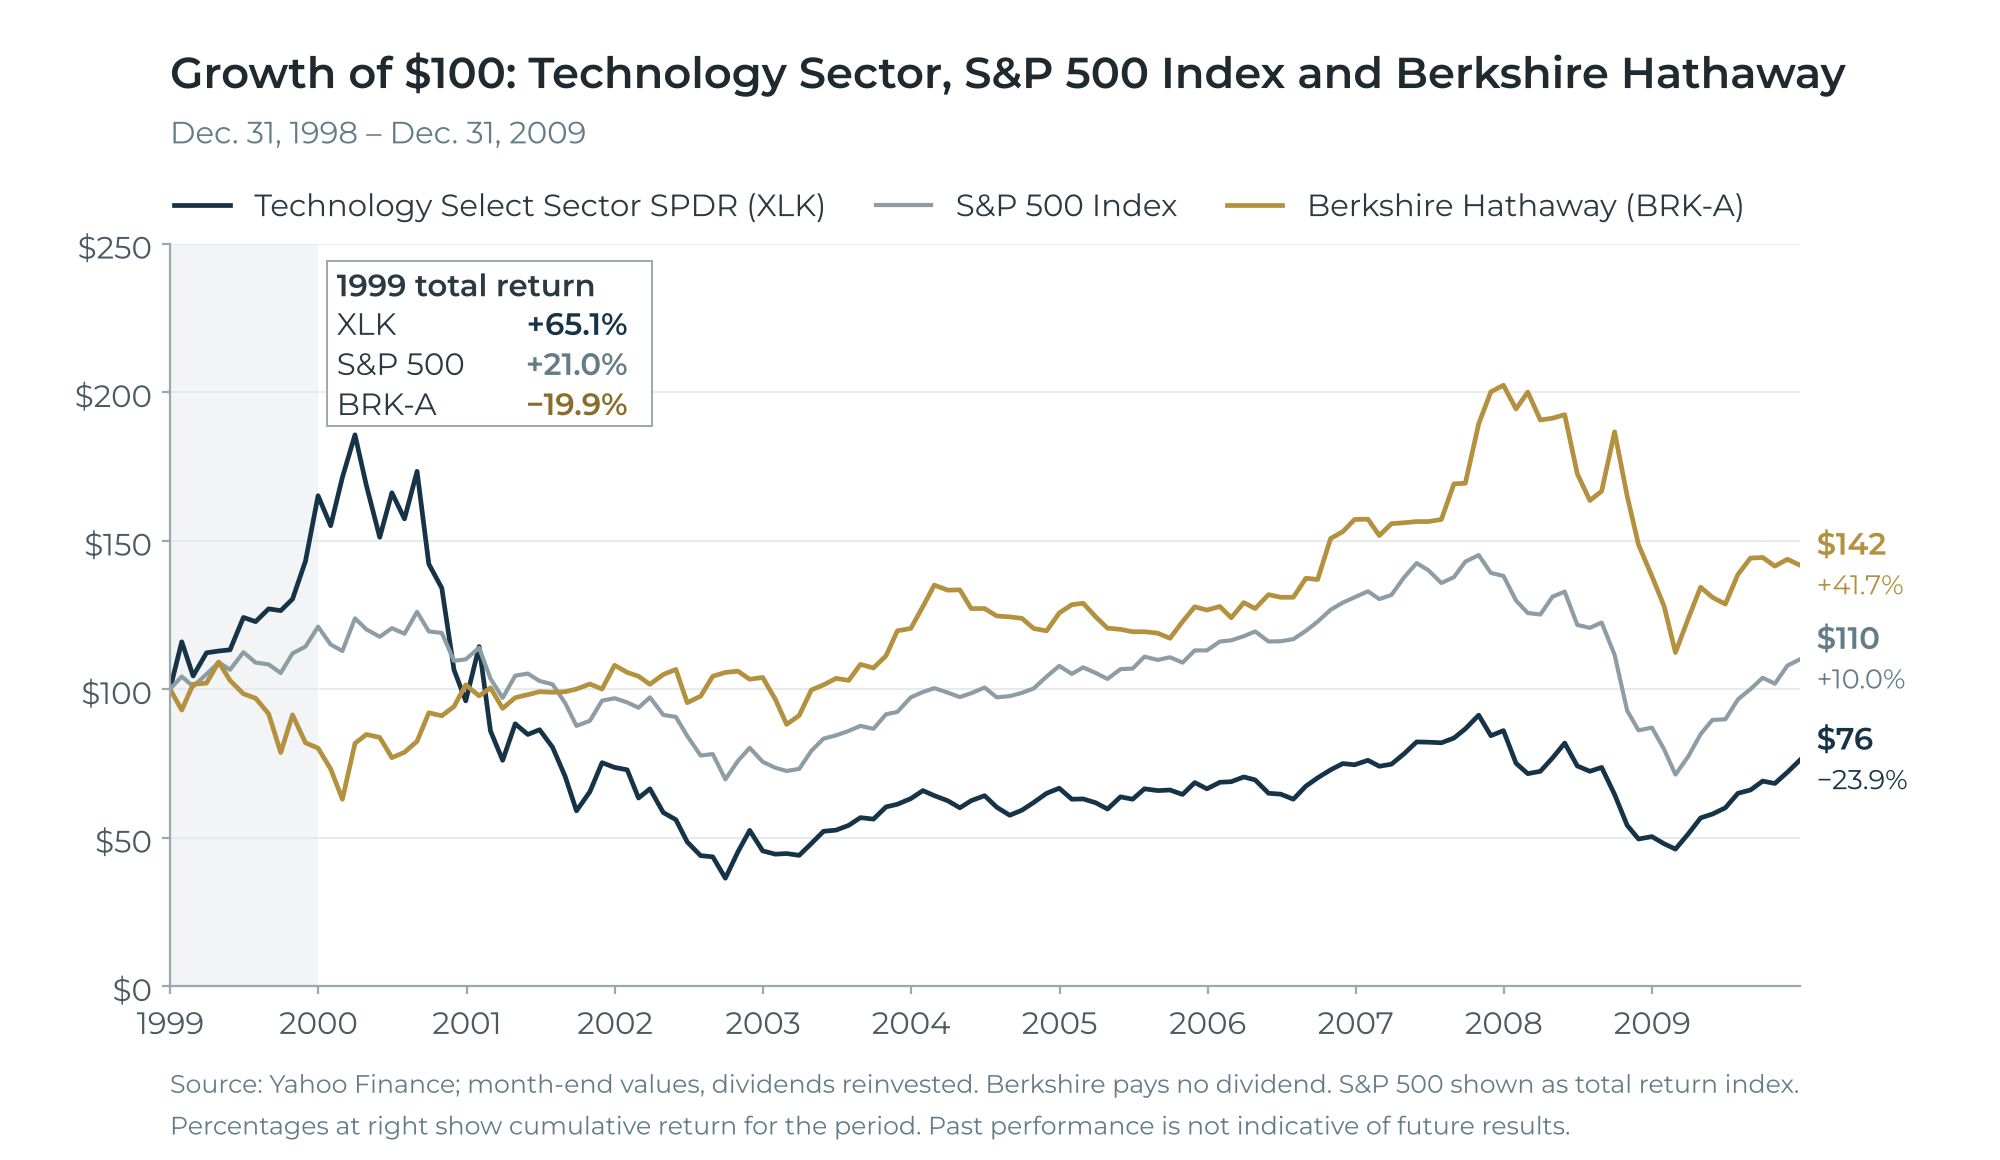
² Berkshire Hathaway figures reflect the change in per-share market value of Berkshire Hathaway Class A shares; S&P 500 figures include reinvested dividends. Data from 1965 through 2024 are from Berkshire Hathaway's 2024 Annual Report; figures thereafter reflect market prices through September 30, 2026. Shown for illustrative purposes only; not a projection and not the performance of any IPW client account or strategy.
Resilience or Overheating?
The U.S. economy again proved resilient to higher energy prices, AI-related job displacement and elevated borrowing costs throughout the third quarter. At some point, however, resilience can become overheating. The Federal Reserve indicated as much at their September meeting, as the FOMC increased rates by 25 bps to 3.75-4.00%, its first rate hike in over three years. Energy prices are reflected in nearly everything we consume as an economy, from direct inputs to the cost of transportation, impacting the prices we pay as consumers. In other words, inflation. Fed Chair Kevin Warsh’s first few months at the helm have confirmed his more hawkish stance (prioritizing inflation containment with higher rates) and the third quarter’s continued uptick in headline CPI gave he and his committee strong reason to begin combatting.
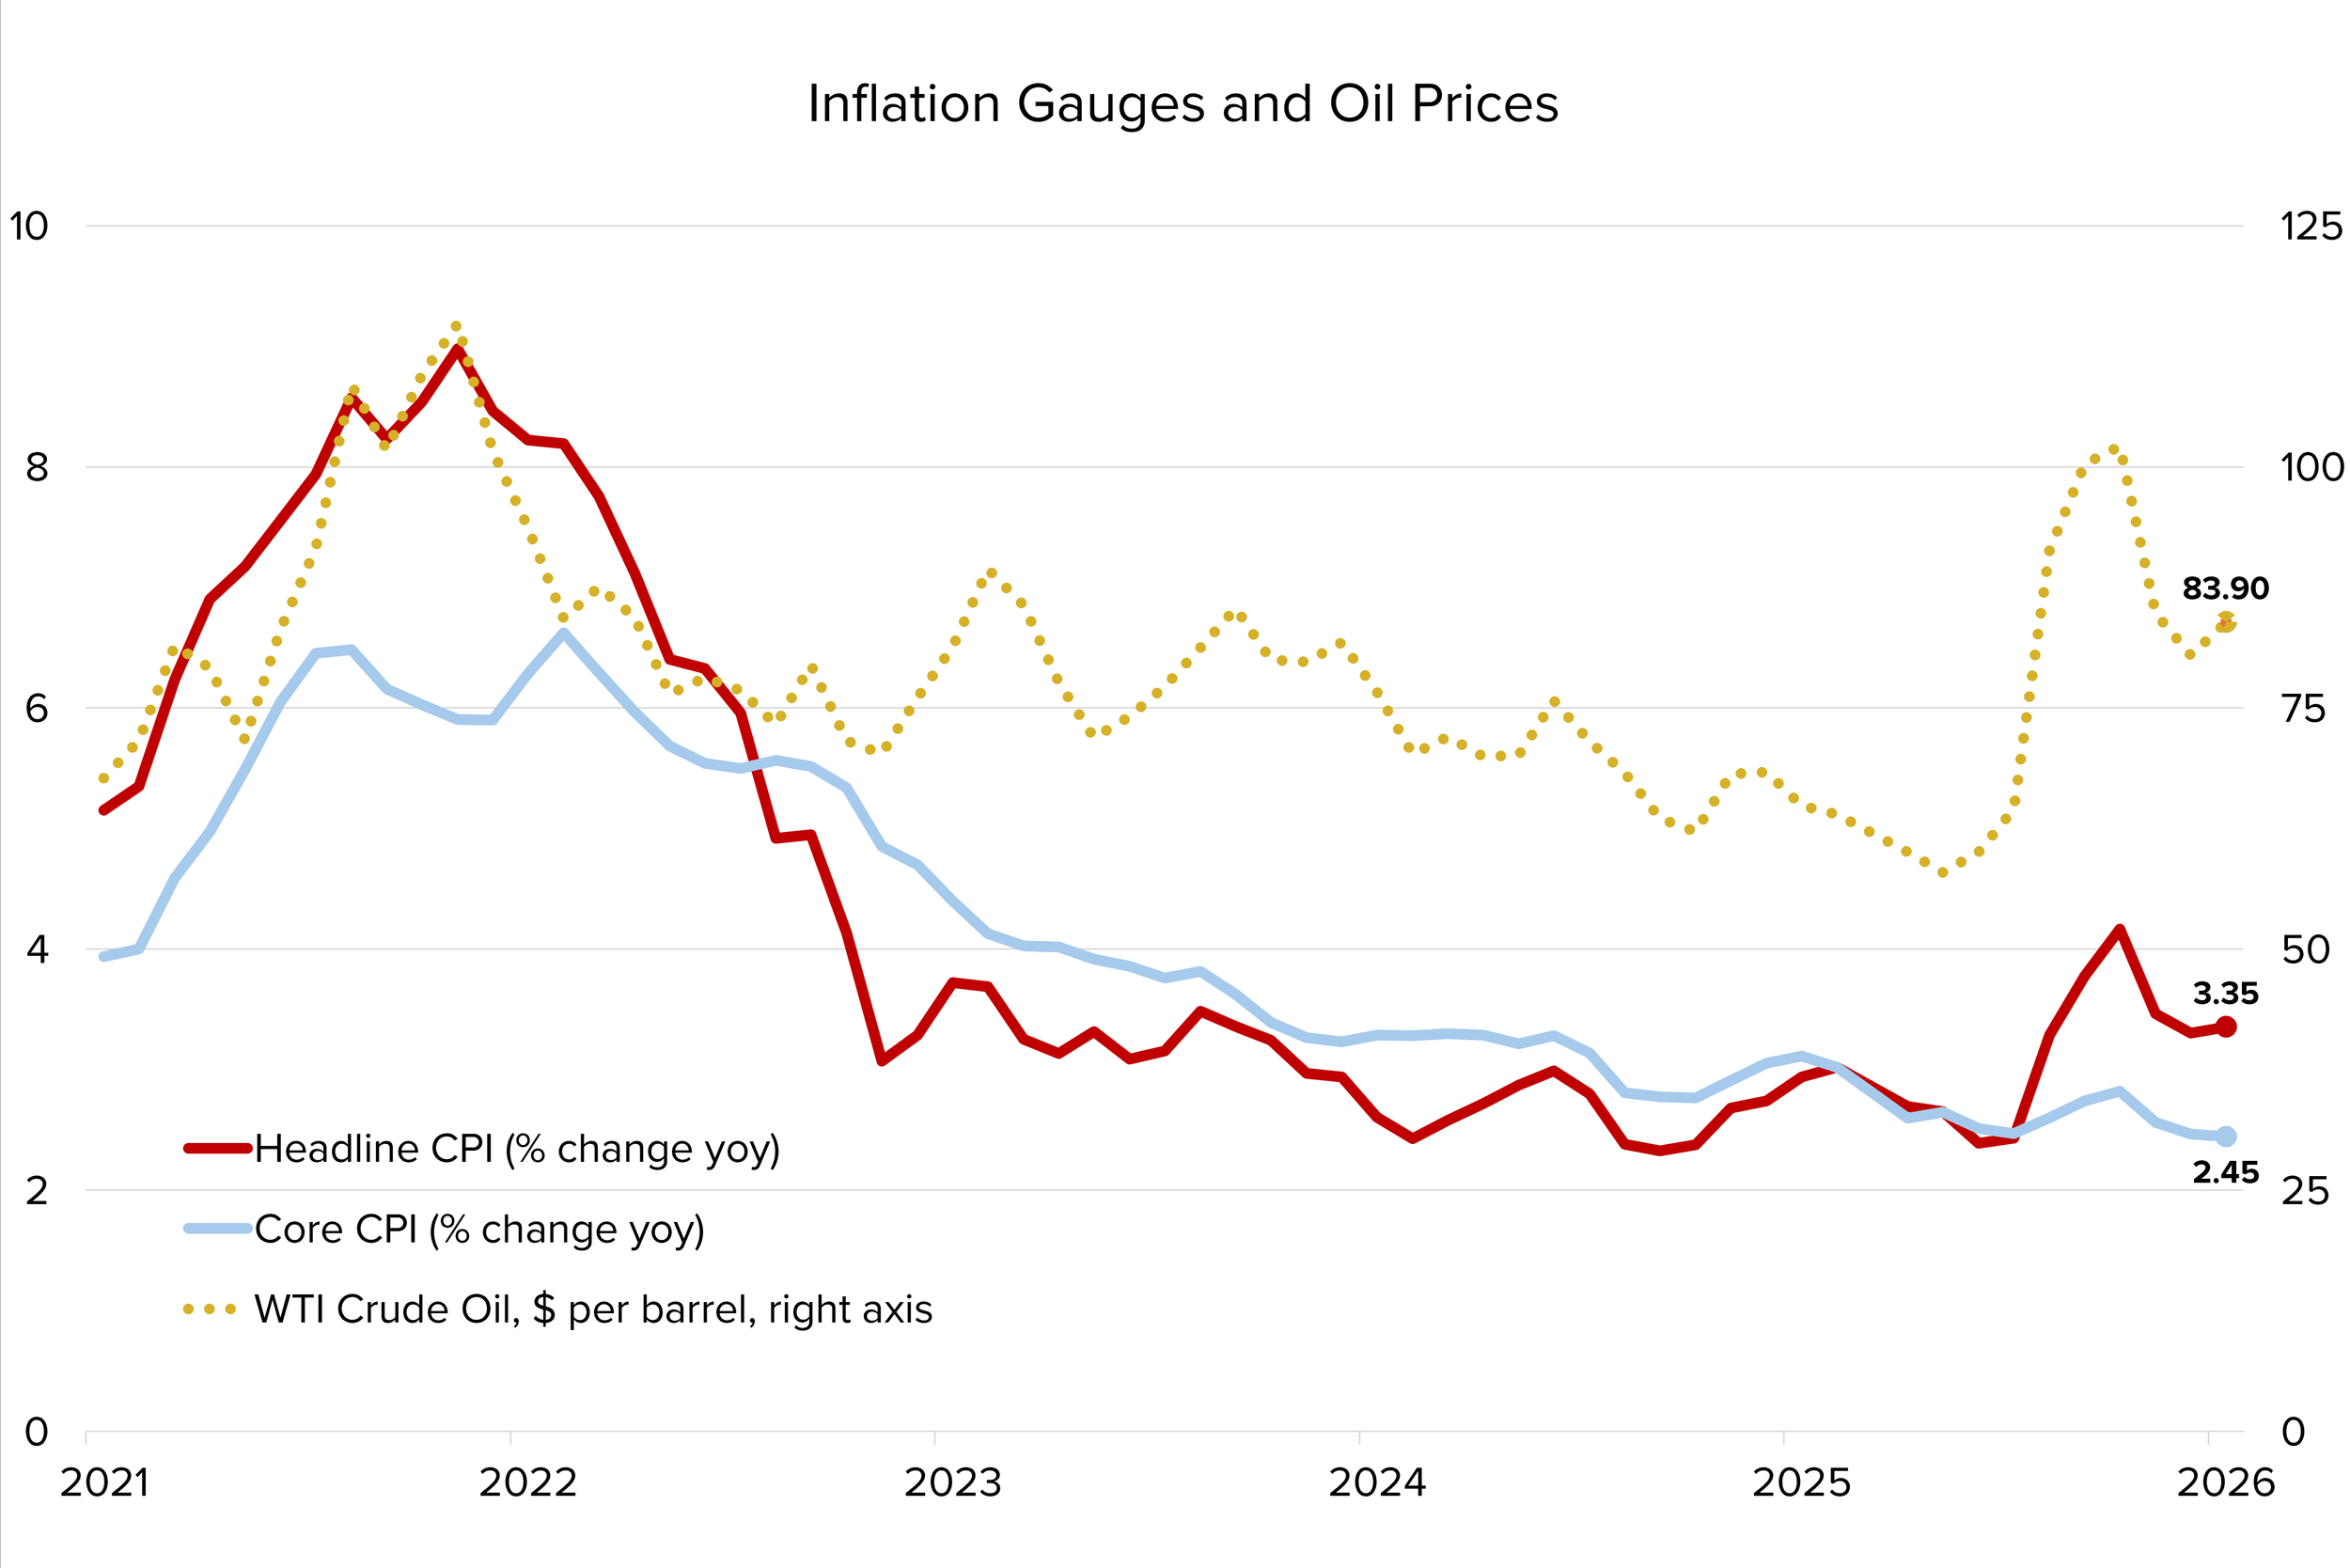
Source: Infinity Private Wealth, Federal Reserve Bank of St. Louis
But as we wrote about last quarter, and a trend that continued through September, core inflation - which removes food and energy inflation - has remained low and for the most part declining. As shown in the chart above, headline inflation has moved largely in line with the price of oil this year. If (or when) oil supply eases up and prices moderate, inflation should stabilize.
On the other side of the economic equation is employment, which of course provides consumers with the capacity to spend. In 2021 and 2022 when inflation was accelerating, wage growth was also at historically elevated levels. Periods of high and increasing wage growth, while seemingly good for workers as their paychecks increase, can lead to a wage-price spiral, where companies must pay higher wages to attract and retain talent and thus pass those higher costs along to consumers. We saw some of these dynamics in 2021 and 2022, as shown below, where higher wages coincided with higher input costs for businesses, adding to broader inflationary pressures. Fortunately, the current economic environment does not seem to share these same characteristics. Wage growth appears healthy, around 3% yoy, but remains in a moderating trend rather than accelerating. At the same time, employment has proven stable with the latest unemployment rate reading 4.2%, well below the long-term average of around 5.7%.
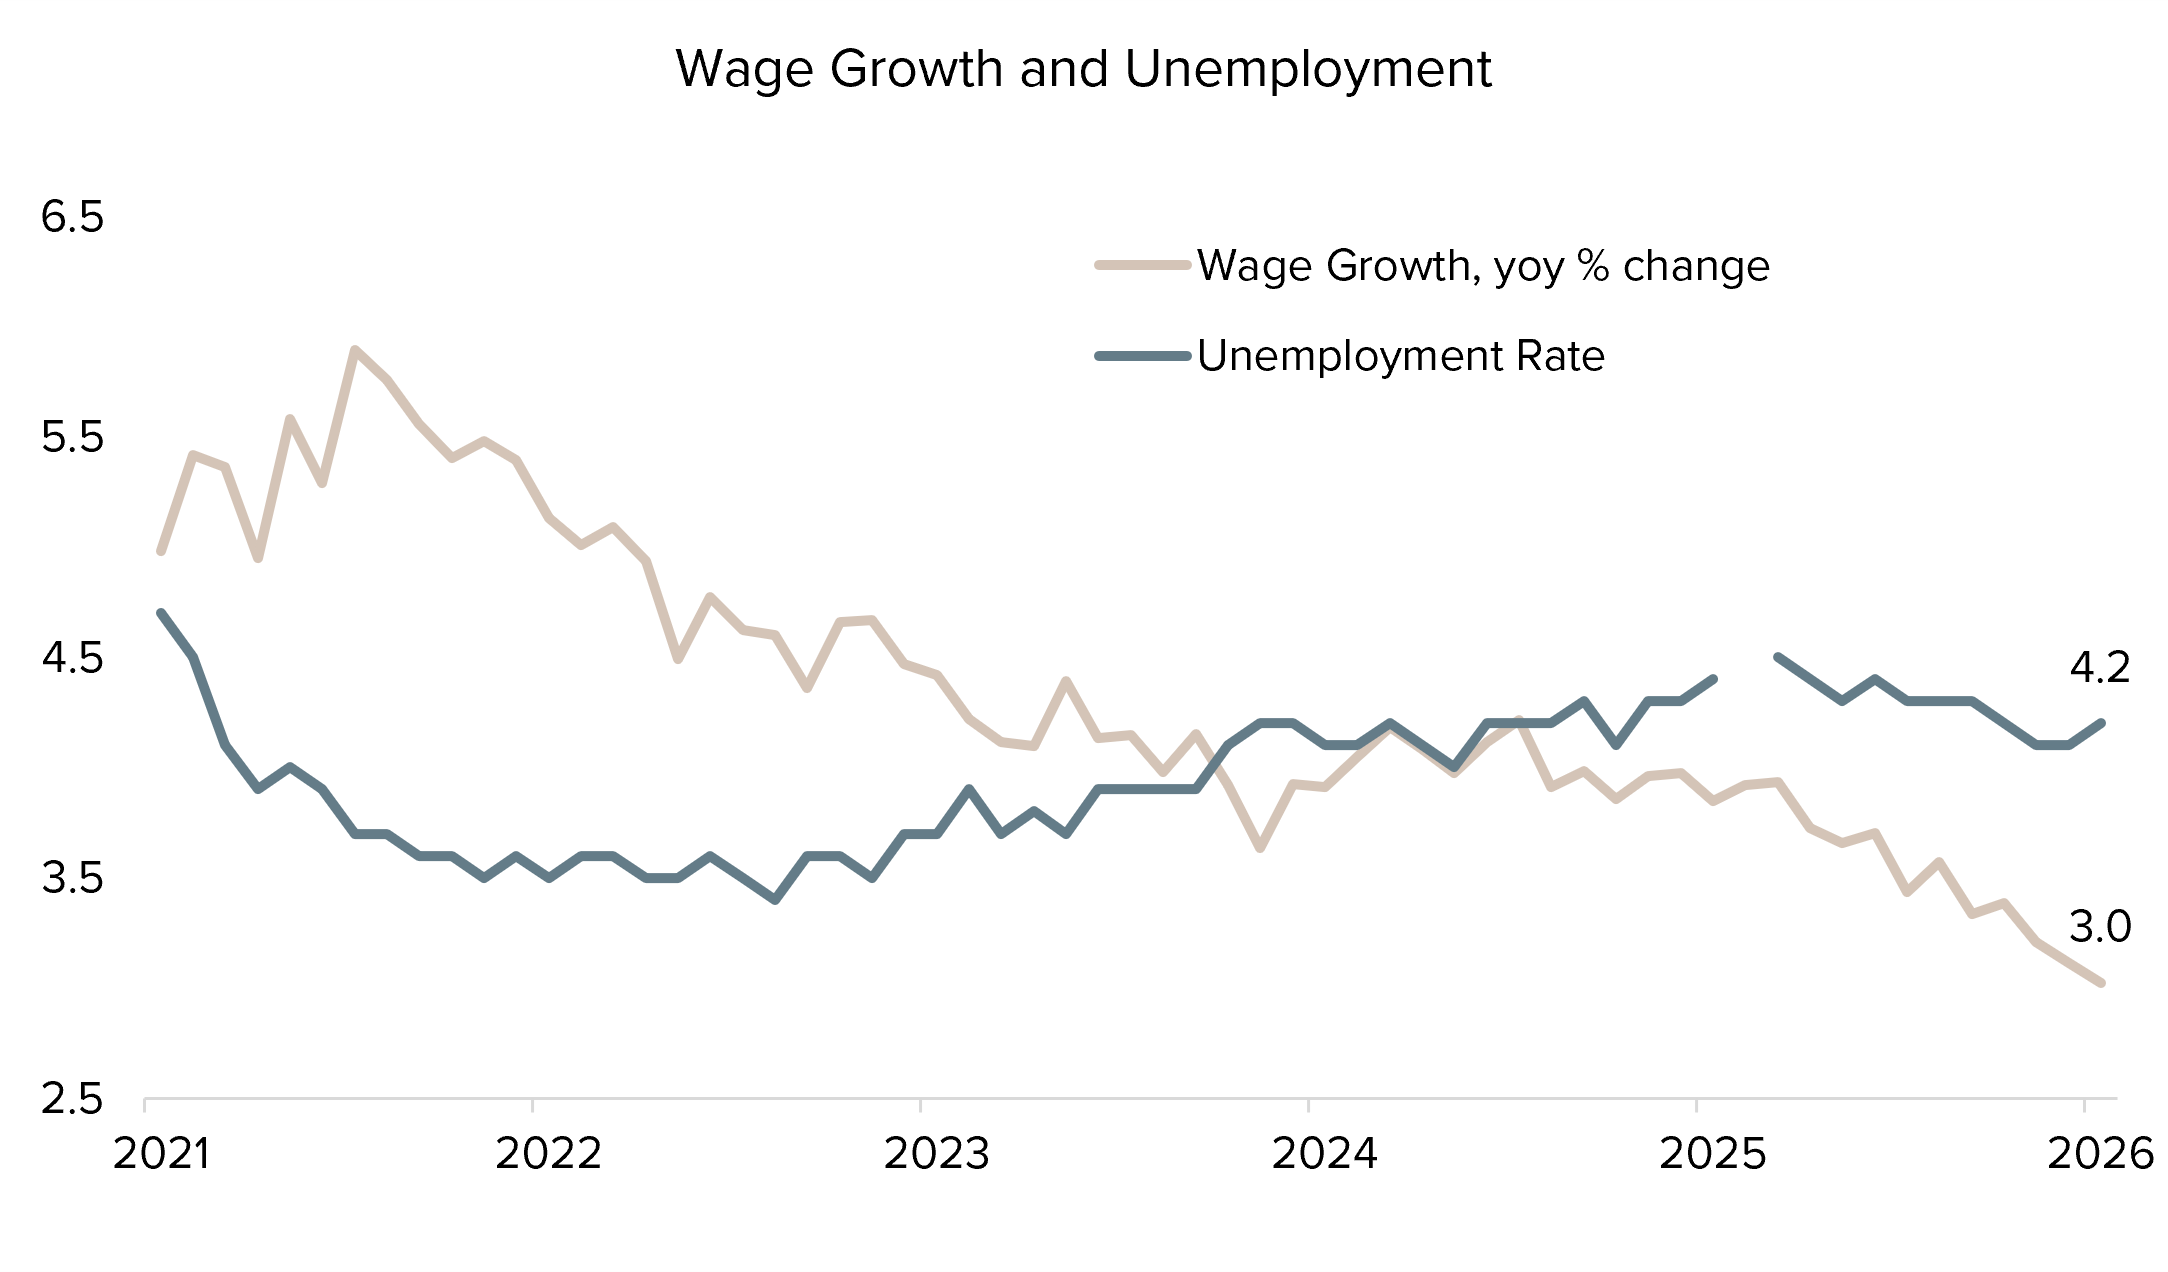
Source: Infinity Private Wealth, Federal Reserve Bank of St. Louis
In aggregate, the U.S. economy is in seemingly good shape. Even though prices at the gas pump are 27% higher than a year ago, household net worth has increased by about 12% over the same period, allowing consumers to absorb the higher prices with relatively little impact to spending. The question moving forward is whether the accelerating inflation is cyclical (due strictly to oil prices and the supply shock) or structural, which could take longer to mitigate. For now, the former appears to be the answer, in which case inflationary pressure should subside if geopolitical tensions ease and oil supply opens up. In the meantime, markets are pricing in about a 67% chance that another interest rate hike will take place before year-end, which may keep asset prices rangebound in the meantime. This is according to CME Group’s FedWatch tool, probabilities as of 10/2/2026.
Multi-Year Highs
While equity markets approach all-time highs, fixed income yields continued their climb to multi-year highs in the third quarter. Several factors have contributed to the recent move higher in interest rates, which has been a global shift rather than isolated to the U.S. According to global bond manager PIMCO, the rise in rates reflects three primary market views:
A stronger global growth outlook and expectations of more restrictive monetary policy
Greater competition for capital as AI infrastructure development relies more heavily on debt than free cash flow, and
Shifting supply and demand dynamics within debt markets globally
Bond investors have been reflecting their view of stronger economic growth and tighter monetary policy, not necessarily higher inflation expectations. According to PIMCO, real yields – those adjusted for inflation – not inflation expectations, are driving nominal yields higher. This can be inferred by looking at the 10-year breakeven rate, which has remained relatively unchanged, while real yields have increased more than 75 bps since March. These real rates are driven by two primary components, the neutral interest rate level, one which is neither restrictive or stimulative to the overall economy, and the term premium which reflects the incremental yield that investors demand for extending their lending horizon.
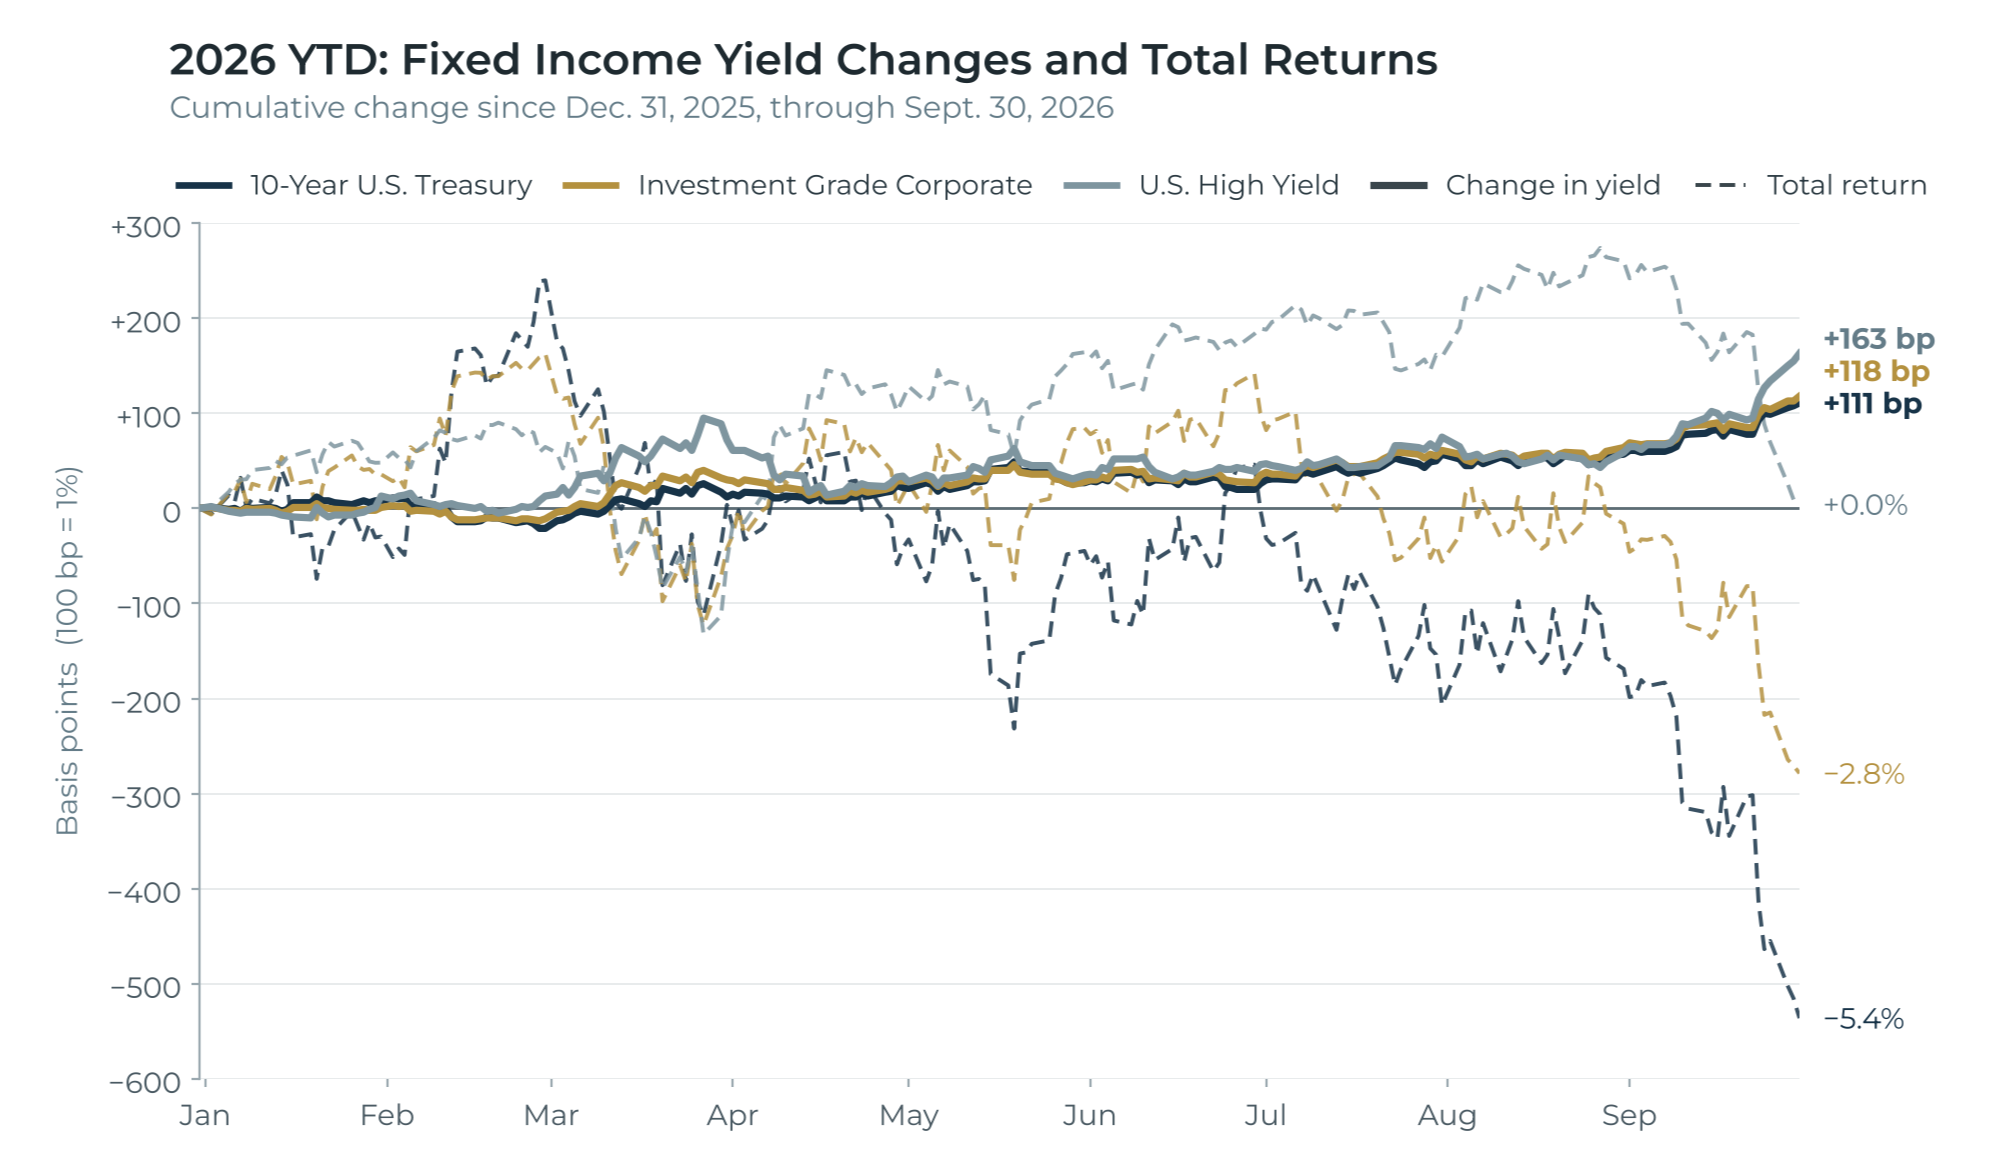
Source: Federal Reserve Bank of St. Louis (FRED); ICE BofA US Corporate and US High Yield indices (effective yield, total return). 10-year Treasury total return estimated from the daily 10-year constant-maturity yield. Past performance is not indicative of future results.
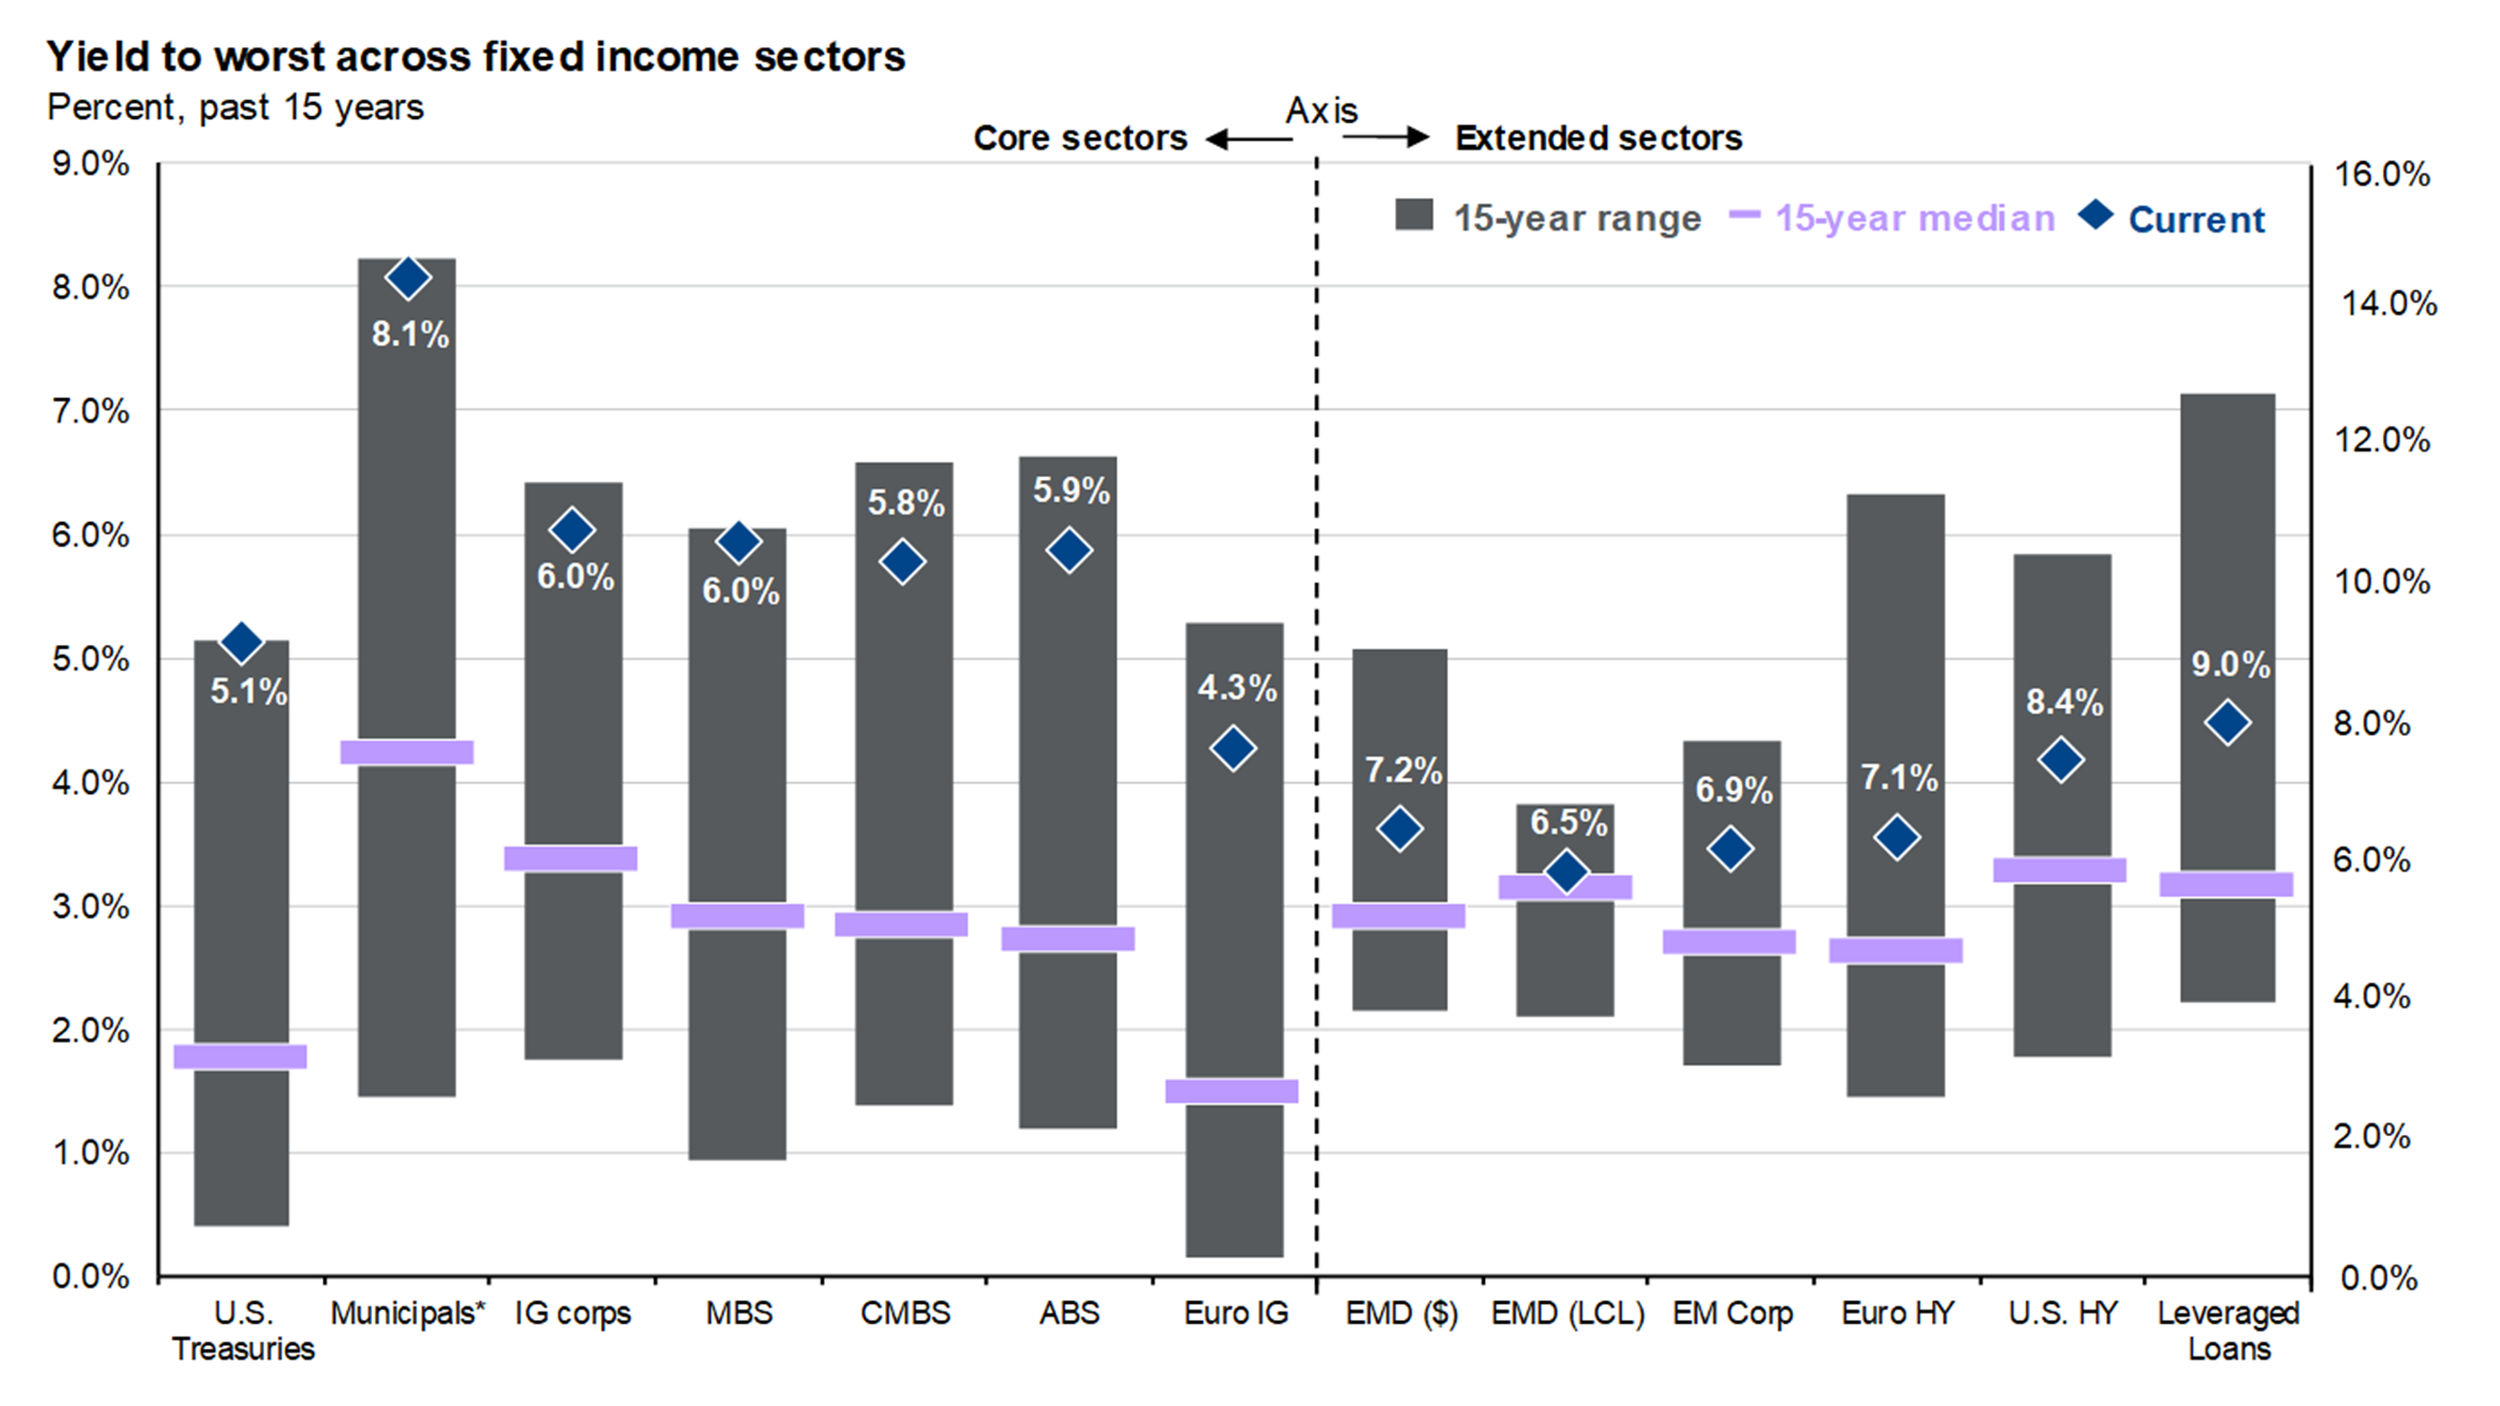
Source: Bloomberg, FactSet, J.P. Morgan Global Research, J.P. Morgan Asset Management. *All sectors shown are yield to worst except for Municipals, which is based on the tax-equivalent yield to worst assuming a top income tax bracket rate of 37% plus a Medicare tax rate of 3.8%. Data are as of September 30, 2026
Greater competition for capital has also contributed to rising yields. Fresh debt and equity issuance across capital markets can drive required returns higher in order to attract investor dollars from a finite pool of capital. According to Goldman Sachs, investment grade debt issuance (dollar-denominated) is on pace to surpass the pandemic-era high, with more than $1.5 trillion of bonds issued already in 2026. Within that aggregate amount, there have been nearly 20 “jumbo” deals in which a single issuance is at least $10 billion, according to research from Nationwide Investment Group. These jumbo deals have accounted for about $384 billion in total, nearly double the number of similar transactions last year. Finally, Nationwide notes that approximately 60% of these deals are attributable to technology companies. Although well capitalized currently, we can see from the charts to the right that as the “only play in town,” hyperscalers demand more and more investor dollars to complete their highly capital-intensive infrastructure buildouts, their share of investment grade bond market is projected to increase dramatically in the near-to-medium term.
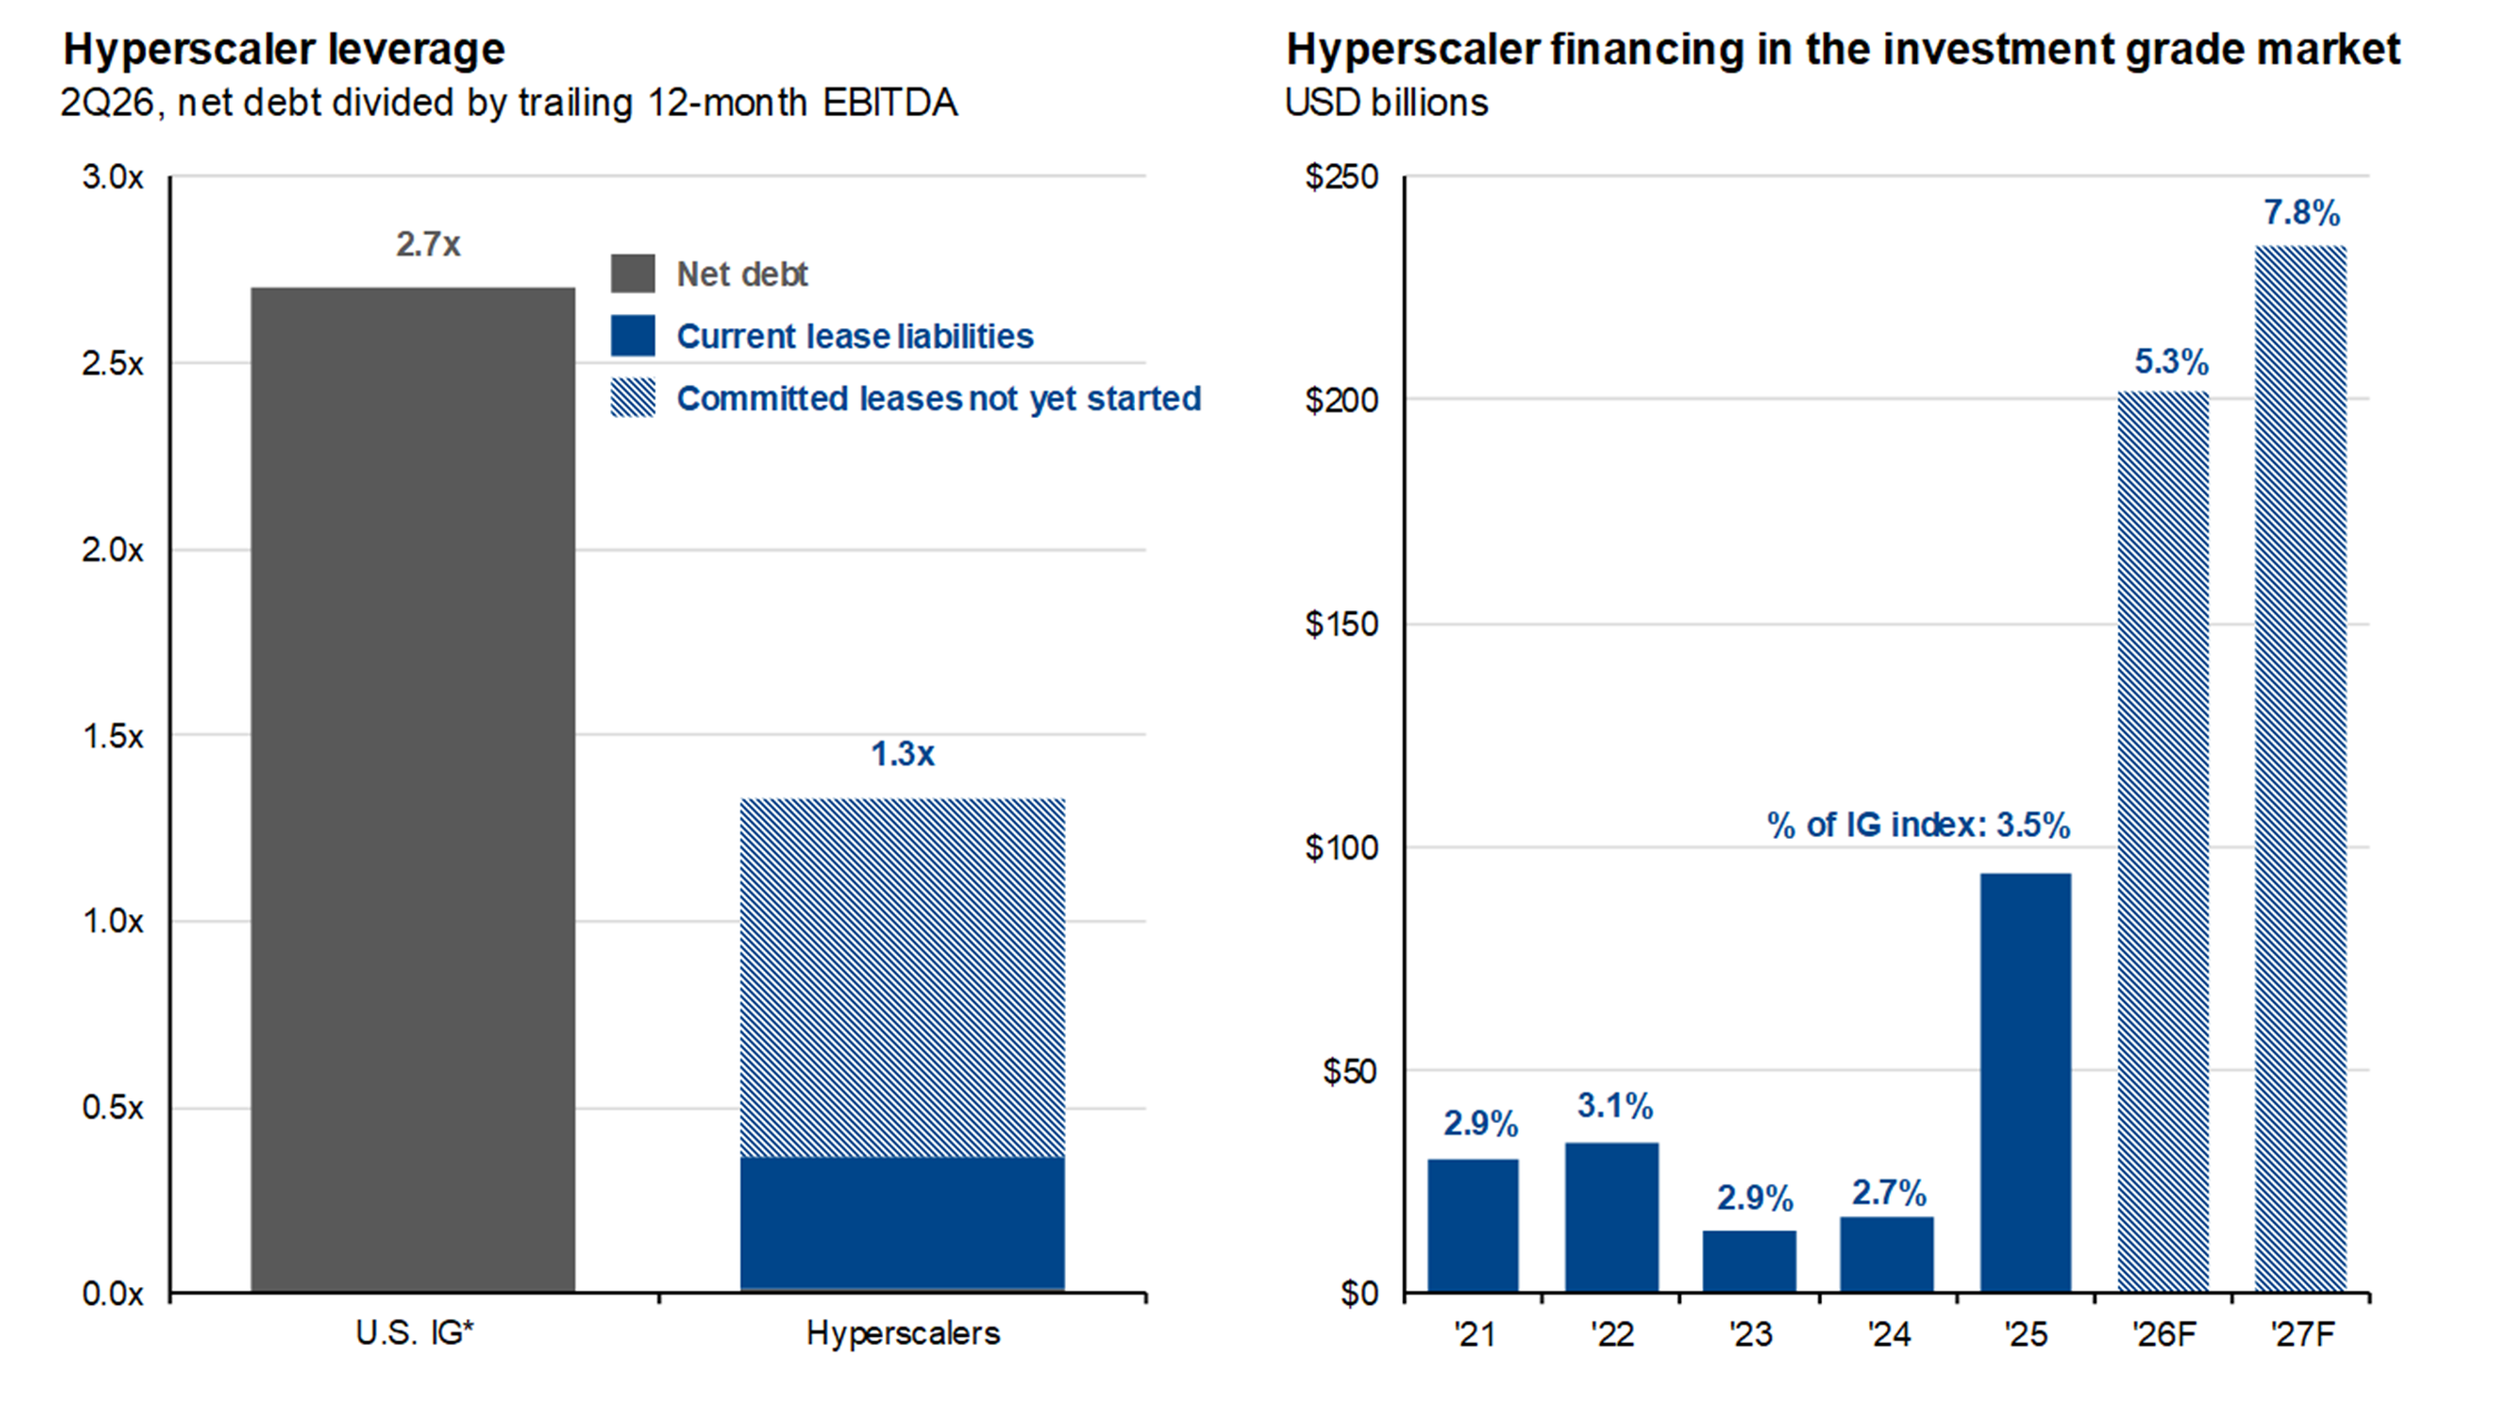
Source: Bloomberg, FactSet, J.P. Morgan Global Research, J.P. Morgan Asset Management.
In a world of post-ZIRP (zero interest rate policy) yields, bond markets continue to adjust to a more normal capital market and economic environment. For diversified investors, careful security selection and thoughtful asset allocation remain a foundational consideration.
Under the Hood of All-Time Highs
As of September 30th, the S&P 500 was up more than 11% (price return) and only 2% below its intraday all-time high reached in mid-August. Beneath the surface, however, about two-thirds of the stocks within the index are actually underperforming the index itself, according to Ben Carlson of Ritholtz Wealth Management. Nearly 40% of stocks are negative year-to-date, and about 25% are down by more than 10%. On the other hand, 19 stocks are up by more than 100% year-to-date, according to Carlson’s article. To succinctly characterize the equity market so far in 2026, there are more stocks with negative returns than stocks beating the index; many losers and handful of really big winners. This has led to even wider dispersion, where individual stocks move more independently rather than in the same direction, throughout 2026. Not only that, but this year’s market has been anchored by an even higher concentration of stocks, primarily those tied directly or indirectly to the AI-related capital cycle. As of the end of Q3, just 10 companies accounted for 40% of the S&P 500 index market capitalization, up 4 percentage points from the same time last year. What was once thought of as a way to “own the market” has quickly become a way to own a relatively-concentrated basket of mega-cap growth companies. Of course, this basket has produced magnificent returns over the past decade-plus, and the earnings growth of these companies has continued to support their trillion-dollar valuations – for now.
The challenge with investing, which, at the end of the day, is simply a belief that the future will be better than the present, is to constantly consider the next 10 years instead of the past 10. According to J.P. Morgan Asset Management’s recent Guide to the Markets, only two stocks that were in the top 10 largest S&P 500 companies at the beginning of 2015 remain in the top 10 today – those two being Microsoft and Apple.
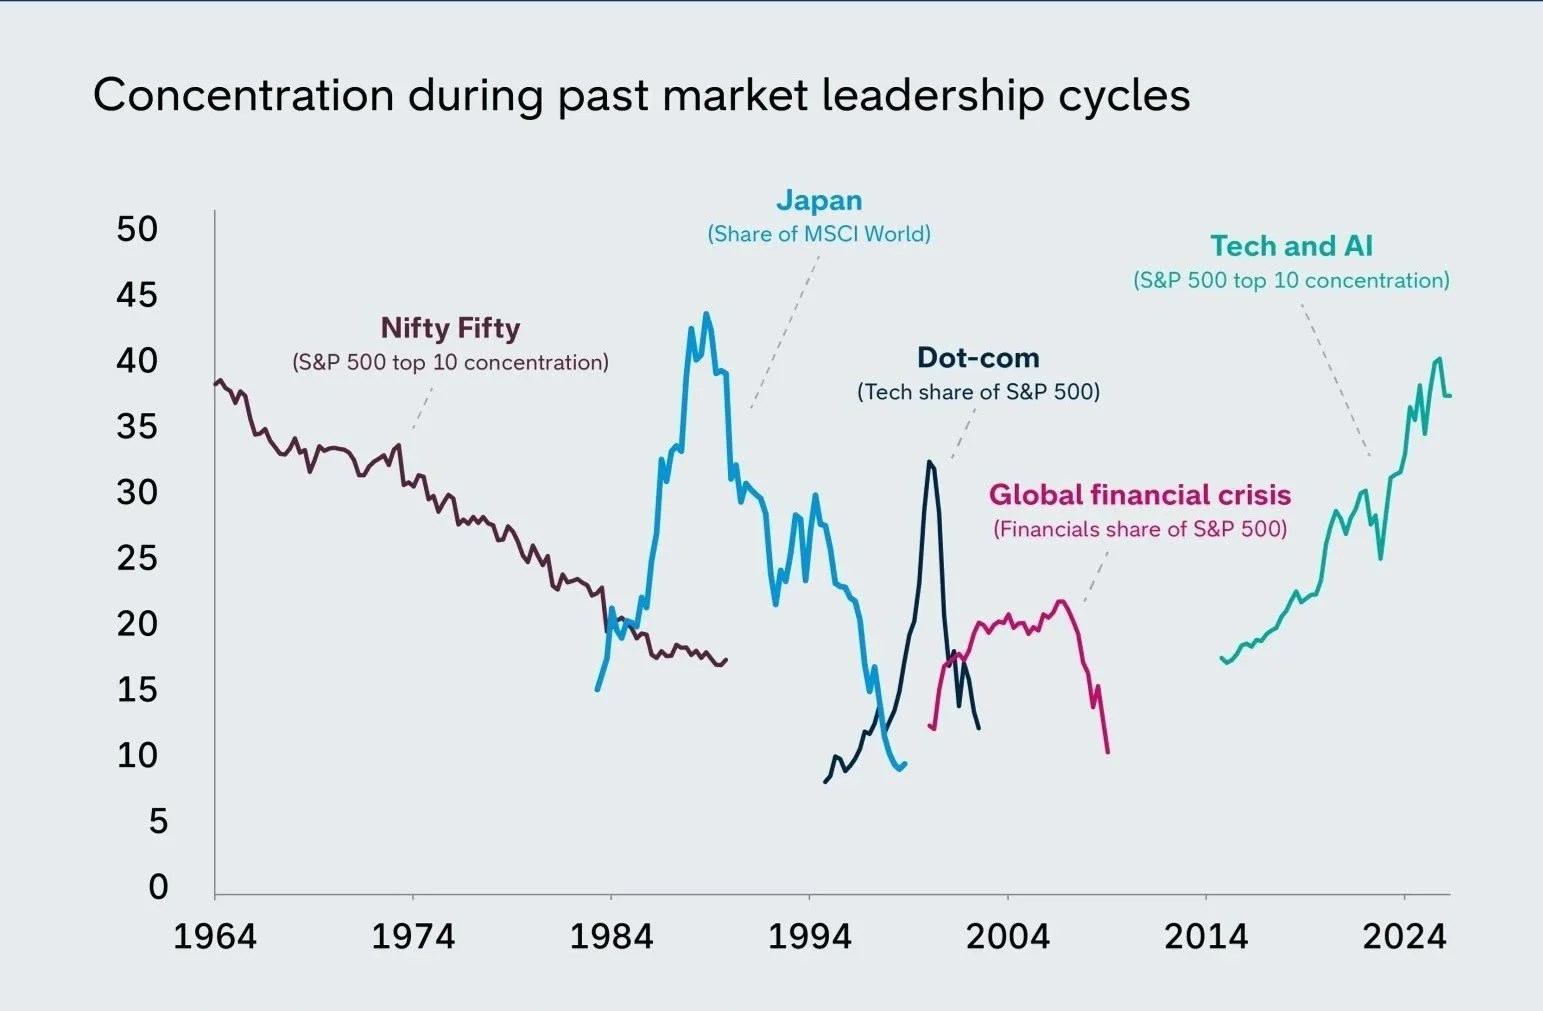
Sources: Capital Group, FactSet, MSCI, RIMES, S&P Global. Data shown is quarterly from March 31, 1964, to June 30, 2026. The Nifty Fifty were 50 large-cap U.S. stocks that drove elevated index concentration in the late 1960s and early 1970s. Data prior to 1964 is unavailable, so the full Nifty Fifty concentration cycle is not shown. Japan represented by the MSCI Japan Index. Top 10 concentration is defined as the share of index market capitalization represented by the 10 largest index constituents. Share represents the specified sector’s percentage weight in the index. MSCI Japan Index is designed to measure the performance of the large- and mid-cap segments of the Japanese market. The MSCI World Index captures large- and mid-cap representation across Developed Markets countries covering about 85% of the free float-adjusted market capitalization in each country. S&P 500 Index tracks the stocks of around 500 primarily large-cap, U.S. based companies.
While a few big winners power today’s market, investors who look under the hood of the index may find valuable opportunities that end up powering the next 10 years. And we’ve seen this story before: the only play in town was the “Nifty Fifty” stocks in the 1960s, Japanese stocks in the 1980s and internet stocks in the 1990s. If history tells us anything, it’s that there will likely always be a theme that seems to be the only play in town. But history is also consistent in illustrating the risks of concentrating too much of one’s wealth in the play du jour, as subsequent returns from many former market leaders have been disappointing. Across a century of market cycles, however, investors who maintained thoughtful diversification, ignored the noise of the day, focused on the fundamentals and invested in what they understood have been better positioned to stick with their strategy when chaos ensued.
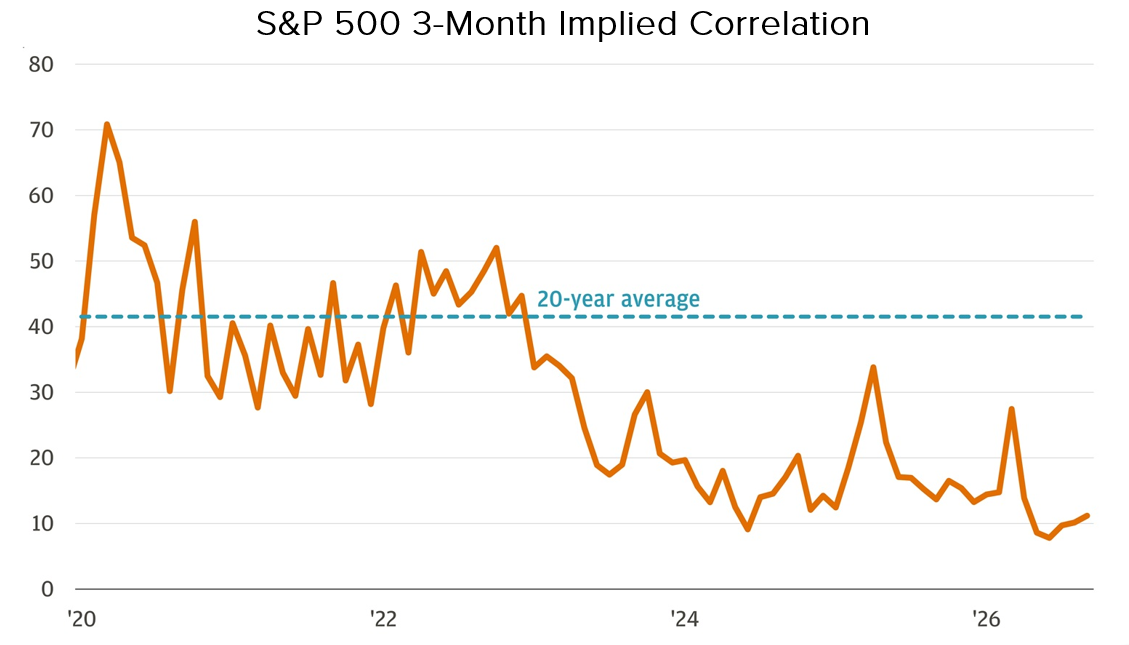
Source: JPMorgan Private Bank, Bloomberg Finance L.P. Data as of September 30, 2026.
Today’s combination of high dispersion (low correlation between individual stocks within the index) and high concentration of the largest companies presents potential opportunities for active judgement in managing a diversified equity portfolio. At the sector level, areas known for cash flow production and stable income generation such as utilities and industrials declined by 12% and 10% in the third quarter, respectively. As investor focus continues to remain on the AI growth story – which will likely produce winners and losers over the next decade – those willing to look beyond today’s most popular stocks could find long-term value underneath the hood.
As Bill Nygren, manager of Oakmark Funds, put it in his recent commentary, the “discipline to stay boring” often yields satisfactory long-term returns.
Know What You Own, and Why You Own It
In life and investing, we humans are experts at getting in our own way. Economic departments full of PhDs have studied the topic for ages and have developed econometric models, utility functions, and other sophisticated mechanisms to forecast how an economy should and would behave as certain conditions change. But as soon as humans, with the freedom to make their own decisions, are put into the mix these models tend to fall apart. We are just emotional beings, susceptible to fear and greed and everything in between that can cloud our decision-making at certain times.
When it comes to investing, or money in general, suboptimal (a fancy word for bad) decision making can become amplified. An entire field of academia has been created on the subject of behavioral economics, which we’ll stop short of exploring here. But the idea is that people get in their own way with money, which is not necessarily novel in and of itself. What is interesting, though, is the research that has been done to show just how much these suboptimal (bad) decisions are costing investors. With this data we can begin to consider how we, as investors, might be able to mitigate our behavioral biases.
Morningstar estimates that the average investor dollar earned approximately 1.2 percentage points less per year than the underlying funds over the ten years ended December 31, 2025, reflecting the timing and magnitude of investor cash flows. While certainly not perfect data, this 1.2% “investor gap” is measured Morningstar in its annual “Mind the Gap” report. The firm analyzed nearly 23,000 funds, both ETFs and open-end funds, to evaluate the investment’s return versus the investor’s return from that fund. In short, they found that the average investor dollar in the aggregate funds earned 8.7% per year for the 10 years ending December 31, 2025, while the actual funds’ returns averaged 9.9% over that same period. A summary of the key findings from this report is in the table below.
If anything, this report does a thorough job of illustrating investor behavior and the drag our behavior can have on long-term returns. Perhaps the most notable takeaway is the fact that the largest gaps in investor returns relative to fund returns came from funds with greater volatility and greater complexity. In other words, it would seem that the more volatile and complex an investment is, the more likely an investor is to underperform the investment. Why does all this matter? Because we invest to achieve some objective, and without knowing that objective it’s very difficult to develop a roadmap. As Yogi Berra would say, “you’ve got to be very careful if you don’t know where you’re going, because you might not get there.” Have an idea where you want your money to take you, then know what you own and why you own it.
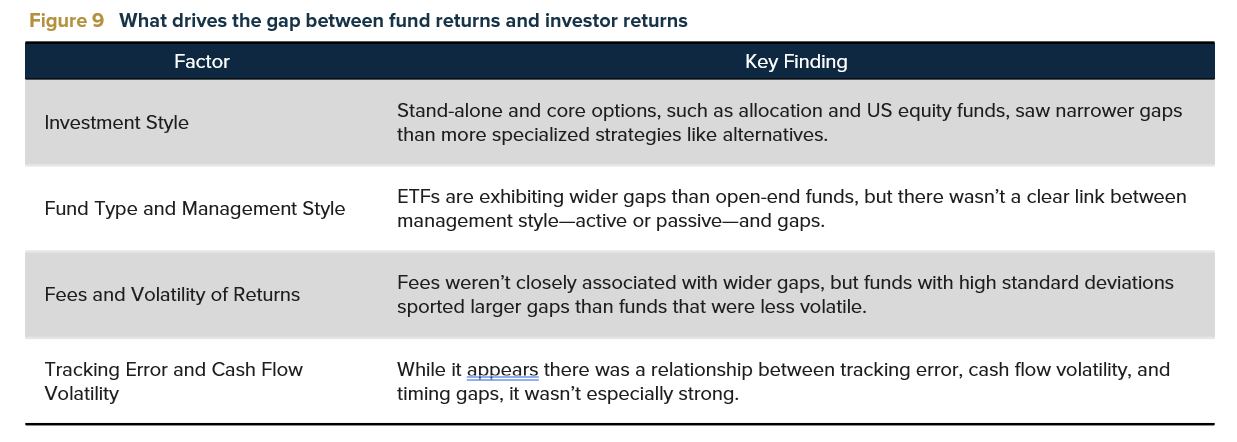
Source: Morningstar, Mind the Gap 2026 report
Important Disclosures
Infinity Private Wealth LLC (“IPW”) is a Registered Investment Adviser registered with the State of Oklahoma. Registration as an investment adviser does not imply a certain level of skill or training, and the content of this communication has not been approved or verified by the SEC or by any state securities authority.
This material is a general market and economic related commentary for informational purposes only. It is educational in nature and not designed to be a recommendation for any specific investment product, strategy, plan feature or other purpose. Any examples used are generic, hypothetical and for illustration purposes only. Prior to making any investment or financial decisions, an investor should seek individualized advice from a personal financial, legal, tax and other professional advisors that consider all the particular facts and circumstances of an investor's own situation.. Information regarding investment products and services are provided solely to read about our investment philosophy and our strategies. This material contains forward-looking statements and opinions about economic conditions, interest rates, inflation and market trends. These statements are based on current expectations and assumptions that may prove incorrect, and actual results may differ materially. All investing involves risk, including the possible loss of principal. Diversification and asset allocation do not ensure a profit or protect against loss. Bond prices generally fall when interest rates rise, and high-yield bonds carry greater credit and default risk than investment-grade bonds. Market data, articles and other content in this material are based on generally-available information and are believed to be reliable. IPW does not guarantee the accuracy of the information contained in this material. This material may include forward-looking statements, which are not guarantees of future performance and involve risks and uncertainties.
Infinity Private Wealth LLC will provide all prospective clients with a copy of our current Form ADV, Part 2A (Disclosure Brochure) prior to commencing an advisory relationship. However, at any time, you can view our current Form ADV, Part 2A at adviserinfo.sec.gov. In addition, you can contact us to request a hardcopy.